

🦇 YEET no. 14: Gotham
🦇 YEET no. 14: Gotham
Welcome to The Yeet, a weekly DD where we try to tilt the casino...

Hey! I’m @yourboymilt, and welcome to retail’s Sunday Paper.
A big welcome to The YEET! I should probably let you know...This is not financial advice! We are here to entertain while giving you ideas, perspective, and angles. Do your own research, I prithee. And if you aren’t subscribed, join us here:
Creator/Editor:@YourBoyMilt The Architect: 🧠 Publishing Associate:@rclarkspear
Pt. 1: Week’s Thoughts, Pt. 2: Steel DD (@jameoneill), Pt. 3: Build-A-Trader (B-A-T) 5: Spotting Trends Pt. 1, Pt. 4: DD on F13s (@careerlow), Pt. 5: Watchlist, Pt. 6: Index Forecasts (@daarkmaagician ) Pt. 7: TLDR
🦇 Pt. 1: Gotham
You either die a hero, or live long enough to see yourself become the villain.
Oh, how we could’ve used the protection of our Dark Knight and savior Jerome Powell to end this week.

Okay, okay, maybe things aren’t as bleak as they seem; after all, The DOW is up 13% on the year and Tech is still roaring, for the most part. If you zoom out and manage expectations that were warped by last year’s epic bounce back, then, yes, it seems that the bull market is chugging along, even if slowly. On a shitty week full of bleh news like this one, though, it seems that the creeping number of bearish factors is finally starting to become overwhelming; the market is a rogue's gallery of villainous obstacles at every turn. Prior to this troublesome period, bulls had the protection of the endless production of manufactured pumps; quantitative easing, stimmys, Biden’s EV pumps, etc.. For every bearish foe we faced, there was a heroic swoop waiting around the corner to carry us to the safety of green. Well, hold your loved ones close, because there is no longer justice in the market of Gotham.

Bloody bear crimes everywhere! Did the week end red? Absolutely. Did my account end red? Indeed. I hear the shrill cry of margin calling in the distance. How bad was the week for indexes? The 1% drop in the S&P 500 was the worst we’ve seen in in a month, and same with the 1.9% drop in the Nasdaq. But, it’s how it happened that’s most concerning. The Treasury Yield—which typically is on the rise as tech falls—actually ended the week down again.
The yield on the benchmark 10-year Treasury note briefly shot up before retreating as investors concluded that the U.S. central bank would likely maintain its ultra easy monetary policy stance for a while.
What does that mean to me? It means deep-pocketed investors aren’t tucking their money away into bonds (the safer stock alternative), which is the natural place to look when valuation fears and general frothiness are causing turmoil. So then, in that case, I guess it’d be a safe assumption that this week’s slide was caused by the terrible inflation news we got on Tuesday, right? Not necessarily the case, as the Nasdaq snapped right back to highs of the week the very next morning. Kind of a weird response, but whatever. It’s simply a confusing time to know whether to buy or sell when the market is this downright villainous, even for “seasoned” traders such as myself (lol 😉) .

Sure, the story could be—and probably is—as simple as it seems. We got terrible inflation numbers that the market had a delayed reaction to Wednesday, and on Friday —once retail numbers showed an unexpected .6% increase—people got scared (again) of premature QE tapering. Yes, the dynamic duo, inflation and tapering, constantly bringing chaos and fear to our fine market. That would explain, at least partially, why the “buy-now-ask-later” bullish mantra of the past year is suddenly waning.

But it also feels like something different; hell, it IS something different. The market is beginning to behave like it was before the crash, Gotham, a dichotomous pairing of haves and have nots. On one hand there are those who knew—and compounded—where the price action would go Friday; MMs, whales, and the uber-wealthy. Then, on the other hand, there are those, like you and me, who are chasing flows and charts and graphs and news, anything to get a lead on where the next movement may be. See, it was options expiration day Friday (OpEx), and the volatile moves are determined based on the interests of the wealthy, not investor sentiment. Your favorite stock didn’t move up or down—it got pinned.
If the haves aren’t putting money into fucking bonds, and they’re not putting it into digital currency, and they’re not putting it into commodities like gold and silver...where is it going? That’s a question for a smarter person, I suppose. It would seem, to me, deep pockets can keep sitting on the sidelines while I continue “average down” on JMIA until there’s nothing left. Then, of course, it’ll launch to the moon during earnings season
You either die a hero, or live long enough to see yourself become a villain.
Jerome is our Dark Knight, the one who saved our market from despair over a year ago, yet his heel turn is finally coming. His refusal to break his one rule—admit that economic benchmarks are running hotter than could be expected, and that the Fed’s outlook must change—is beginning to be met with skepticism, anger, and downright confusion. Headlines have gone from universal praise of his leadership to….
Powell defends Fed's inflation stance as GOP lawmakers cast doubt
Fed chair looks in unlikely place for clues on economy’s future
Will the man who saved our market be the one who dooms it? Will the Fed’s lack of response to clear signals that economic benchmarks have shifted beneath us be the push that tips us into the unthinkable; a bear market. Will he continue to tell us not to worry while we have massive sell-offs like Friday, as he’s pimping the new Federal BitCoin?

Who really knows, except the elite class of individuals who knew what was happening Friday with OpEx...and on Thursday, and on Wednesday, and on Tuesday, and on Monday. The market’s a tale of two Gothams with our Batman on the run, hunted, but I’ll still dance with the devil in the pale moonlight (Batman comic nerd Easter Egg).
Good luck next week.

Welcome to YEET no. 14 , brought to you by Arkham Asylum
🏗 Pt. 2: Steel Reserve
Written by: @jameoneill
This week’s sector article recommendation by: @drfancypan7s

Simply put, trading steel stocks is fun. It has a nostalgic allure as a commodity, each purchase bringing the rugged feel of a bygone era of the titans of industry; perhaps that’s because it is the polar opposite of tech. It was the backbone of the industrial revolution and holds a special place in American history. It is also unique in a way because it is one of the few commodities that is just as important and relevant today as it was 100 years ago. It’s the last man standing; oil has been labeled dirty and unsustainable, gold has been replaced by bitcoin, and trading lumber/wheat/corn futures just doesn’t have that same je ne sais quoi. As any experienced Catan player knows, ya just gots to be on that ore. So, steel is for real, and literally tested by the sands of time.

It’s also a great sector for new traders. It encourages research and staying up on current news, global supply chains, legislative activity, and most importantly quoting DMX every time $X is mentioned (it will give it to ya). The charts tend to adhere to general principles and trends, options premiums are relatively low, and it’s not nearly as volatile as tech. There’s also great variation within the sector, and you can practice different approaches with different tickers, which are somewhat outlined in this section. So, make a steel watchlist, and start practicing some of the different B-A-T skills that Milt’s been teaching.
After a hot run steel is obviously down right now as a sector, BUT there are a few reasons on a macro level this is not of concern to us. Foremost; if we take it back to basic supply and demand principles, steel is actually in a great position given the raging demand in comparison to supply. With a ridiculous 215% increase in prices since March 2020, it was on a tear before it hit the skids; its run was partially due to the crazy demand projections for the sector, which are STILL viable:
Worldwide steel demand will grow 5.8% this year to exceed pre-pandemic levels, according to the World Steel Association. China’s consumption, about half of the global total, will keep growing from record levels, while the rest of the world rebounds strongly.

Steel should actually still be on a steady upward trend due to supply/demand imbalance and record prices, but what we’ve seen is that it’s now tied to the infrastructure bill and held hostage by the ongoing debacle playing out in the legislature, so we just been getting that choppity chop chop. As those congressional talks progress, steel gains some steam before falling when there’s a setback. Our lovely congressmen and senators on both sides of the aisle apparently feel like they deserve a summer vacation after all the progress they’ve made in fixing our country’s problem; most are enjoying time at their fancy vacation homes, probably bought with tendies from the insider trading they shamelessly participate in. So hold tight with some reasonable monthlies, because there’s a good chance we’ll see Chuck and Nance start signing some bills when the legislature is back in session this fall. Once that happens, infrastructure construction contracts will start getting inked, and the lucky winners will get a pump.

We’re also looking at two additional increases in demand coming down the pipeline that will affect domestic steel producers. 1⃣ The first is the increase in construction that will result from materials prices going down across the board. While the prices lumber and other materials raged, builders began halting construction phases for their businesses until prices became more manageable for their businesses. More houses and buildings=more steel=more demand=more tendies. I’m no mathematician, but it’s a simple equation. 2⃣ The second factor is the eventual subsiding of the chip shortage, where we’ll see production ramp up and materials such as steel see increased demand. Fortune Magazine says this, so you know I’m not just making shit up:
Once the chip shortage is resolved, the automotive industry is expected to ramp-up. More cars rolling off production lines, means more steel demand.
Fastmarket's Schier was blunt with his short-term steel assessment: "There doesn't appear to be any sign that it is abating anytime soon."
In other words, with these factors, steel has a rosy, long-term outlook aside from the standard COVID bounceback.

Finally, and why we’re excited to dig into the flow and the charts, steel Q2 earnings are coming and all signs point to bullish results and guidance—just the shot in the arm, the industry needs to compound the glorious short-term tendies we’ll see from the infrastructure bill. Instead of soft-plagiarizing this excellent Barchart article, I’ll hit you with a long quote that demonstrates what we’re thinking:
Steel makers are also benefiting from the strength in the non-residential construction market, reflected by strong order activity. The impact of strong demand in major markets will likely get reflected on steel companies’ June-quarter shipment volumes.
Steel prices are also shooting higher on solid demand, tight supply, higher raw material costs and low steel supply-chain inventories globally. U.S. steel prices have witnessed an unprecedented surge this year underpinned by strong underlying supply and demand fundamentals. The benchmark hot-rolled coil (“HRC”) prices cruised above the $1,600 per short ton level in May 2021 and shot past $1,700 per short ton earlier this month. The upward momentum continues with HRC prices breaking above the $1,800 per short ton level recently.
There’s a LOT more we could say about steel, but we’ve gotta a bunch of charts and flow* still left, and Milt says “a boomer steel article can’t take up the entire fucking YEET”, so enjoy some individual ticker analysis below!
*All flow and flow charts are using the following filters:
Ask-side
Premium > $1,000
Only showing results for last hour of trading on 7/16
$MT
Strong fundamentals, r/Vitards approved, solid flow, anticipating huge ER, and good leap potential.
A longtime favorite of the r/vitards crowd, which means there’s no shortage of quality DD out there, and I ain’t about to try to compete with them. They have a strong thesis, and they are long on $MT. But, judging by the flow, they are not the only ones. I mean, their earnings are set to beat McDonalds 😲, need I say more? Think of this as a great opportunity to pretend you’re a boomer and use some throwback trading styles, like doing some actual research and giving a fuck about the fundamentals of a company, instead of only following some millennial furus —you may even get an idea or two to couple with the use of our favorite large ocean mammal on twitter 🐳.
- MT hit its ATH of $33.96 on 5/10/21, did a double-tap on 6/1/21 for good measure, then fell out of its channel to a recent low of $28.18.
- Still well above the daily 200ema, and failing to stay above the hourly 200ema.
- Options have lower volume than X and CLF, so premiums are less likely to be manipulated by bid/ask and will change according to the greeks, unlike my AMC calls…
💡 Trade ideas:
Go Long. Follow the flow and tier in on some leaps. Earnings are a total crap-shoot these days, so be careful. If you really want to gamble with short-dated calls, watch that 200ema and see if it can break through and hold.


NUE
- Recently hit ATH of $110.97, failed to break out on second attempt, then fell below 200ema and sitting on support around $92.
- Lower volume means less likely to be manipulated, but also has higher premiums
- Looks like new strikes were recently added to both monthly/weekly options, which could lead to increased volume from delta hedging
- ER on 7/22. The last two ER’s have been followed by a paump, the last one being an absolute banger of a paump
💡💡 Trade Idea: No need to risk it for the biscuit and load up on weeklies (or just get one or two for the thrill of it). If earnings are good, which it looks like they will be, there will be plenty of time to catch the ride up (see chart for previous pump). Check support/resistance and plan your entry, and more importantly, exit!!!
❗️I do not know any of the technicals, and compared to other steel stocks this one feels pretty toppy, so probably not ideal for Leaps or hodling; think of quick in and out after ER. And don’t be afraid to buy some poots if it drops below current support.❗️


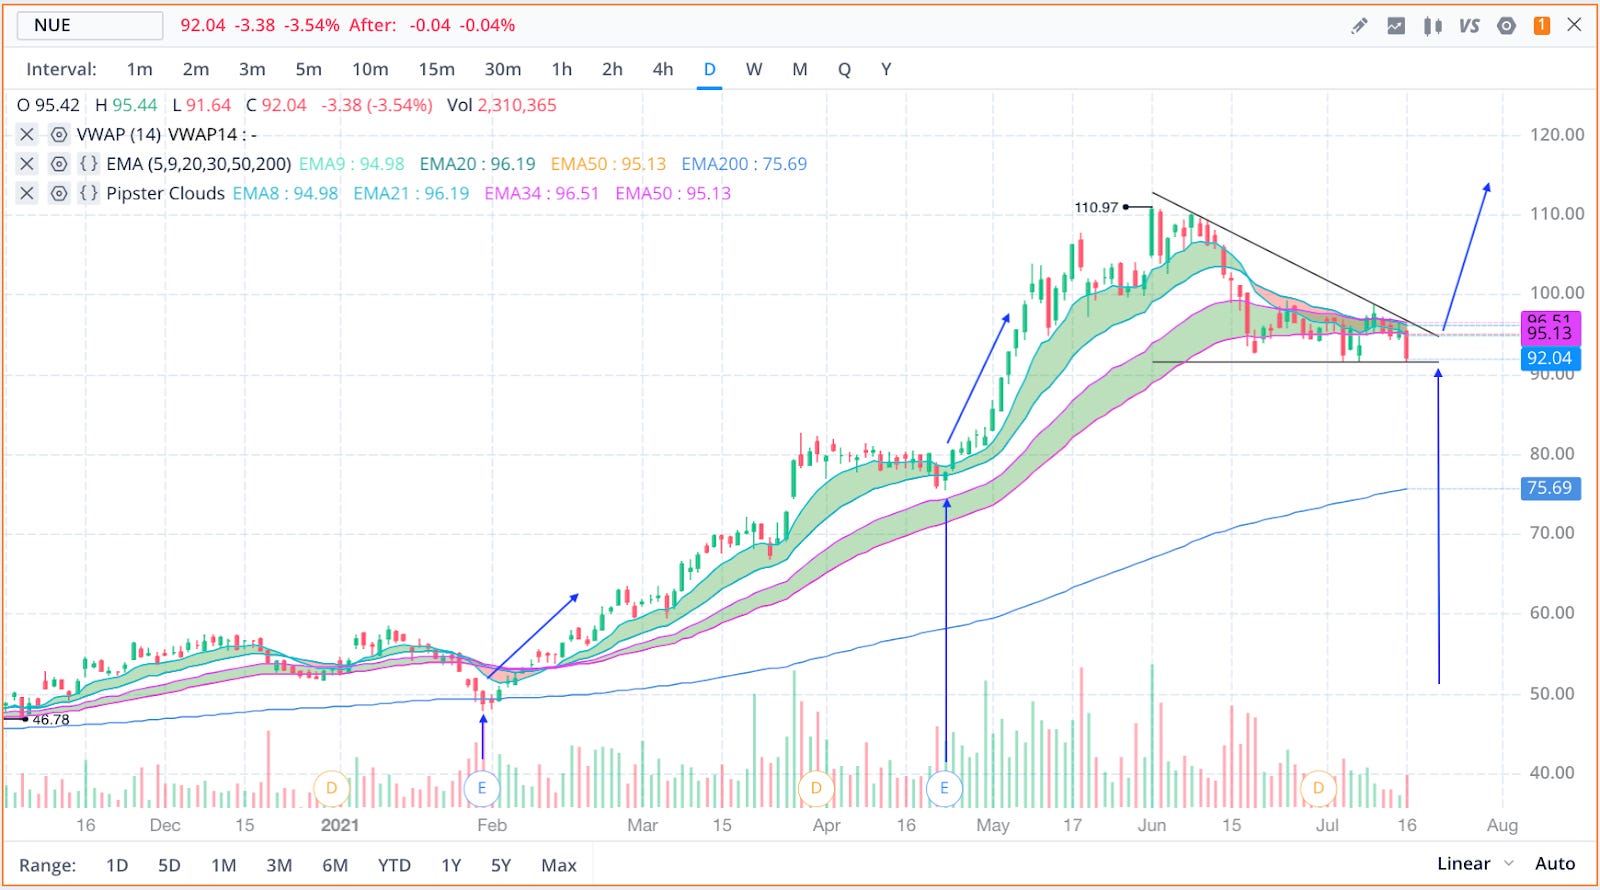

🤷♂️ This could just as easily go the other way, but feels on the edge of a big move
X (gon give it to ya)
- Fell out of channel after failing to bust out another ATH.
- Only steel stonk to be approaching 200ema on daily
- Been focused on reducing debt and had strong Q1 earnings


CLF - Recently adopted by WSB, and it’s flirting with meme status. The IV is high and, therefore, manipulation is likely. 📈 I would put more emphasis on the chart than the flow, and see if it continues in the current channel. This might also have a decent ER runup, but scalp profits quickly (but leave a runner if you can), because there could be some MM fuckery.


Happy Hunting steel gang!
🏗 Pt. 3: Build-A-Trader (B-A-T) 5: Pattern Spotting Pt. 1

Primates have brain functionality that allows them to recognize and combine basic shapes and patterns. Now, so will apes.
Today we’ll be covering with questionable accuracy:
🔹Making trendlines
🔹Double/triple tops and bottoms
🔹Channels
🔹Trend channels
🔹Triangles
🔹Wedges

There’s a basic underlying principle to the psychology of chart patterns that made it way easier for me to understand; you’re not trying to recognize shapes on a chart, you’re trying to recognize how buyers and sellers are affecting price action, and what their behavior likely means. The actual patterns that you see represent shifts in investor sentiment—sometimes buyers are beginning to overtake sellers, or sometimes support is weak and bears are beginning to take hold, etc. Patterns merely reveal investor activity, and the ability to put this activity into patterns is simply a way for you to condense it, then act on that underlying sentiment. If you’re able to remember this then the basic patterns begin to make more sense, and you eventually won’t have to check a cheat sheet as much.
Anyway, let’s get some into some hardcore nerd shit in the endless quest for tendies. Here’s how to spot some patterns!
NOTE: ⏩ A continuation pattern means the conclusion of the pattern is likely to send the price action in the direction it was headed prior to the pattern. ⏪ A reversal pattern is one that signals a turnaround in the price action upon completion.
📉 Creating Trendlines: Your first step
We’ll start super basic with identifying trendlines—this is the building block for most of what you’ll look for. You’re just looking for a trending direction of the price action for the stock chart in front of you; it’s kind of an 👀 eyeball thing you’ll get the hang of. The way I started was just looking along support and resistance lines for an area where it stalls or flattens, or when the price action heads down from a recent peak, or up from a recent bottom. Then you’re going to draw a “trend line” along the two highest points or lowest points in that trending direction (highest for a downtrend, lowest for an uptrend). This one’s an easy example:

⛷ We’ll call the trendlines the “slopes”.
Trend channels (short term continuation pattern, longer term reversal pattern):
These are channels created by two slopes on the upward or downward trendline that the price action stays within. Often, the trendline you draw will have a parallel trendline running with it. This is a trend channel. Let’s make one; we’ll use a downward trend channel for this example.
Start at the top of the slope; it’s okay to cut through wicks or go above them, trends are loose (at least imo). Then, you just do the same thing for the bottom slope. Step 1, 2, 3, 4 labeled below.

🤷♂️ How they tend to move: in the short term they are bearish if the trend is down and bullish if it’s up, but eventually they’re likely to break the opposite direction after some time, making it a mid-to-long term reversal pattern; that’s a breakout. If a support or resistance holds on either side of the trendline, the logical play is to enter it heading up or down, and sell as it approaches the other side. In this one NFLX reaches the top of the trendline, then breaks out downward past resistance (the opposite direction of the trend).
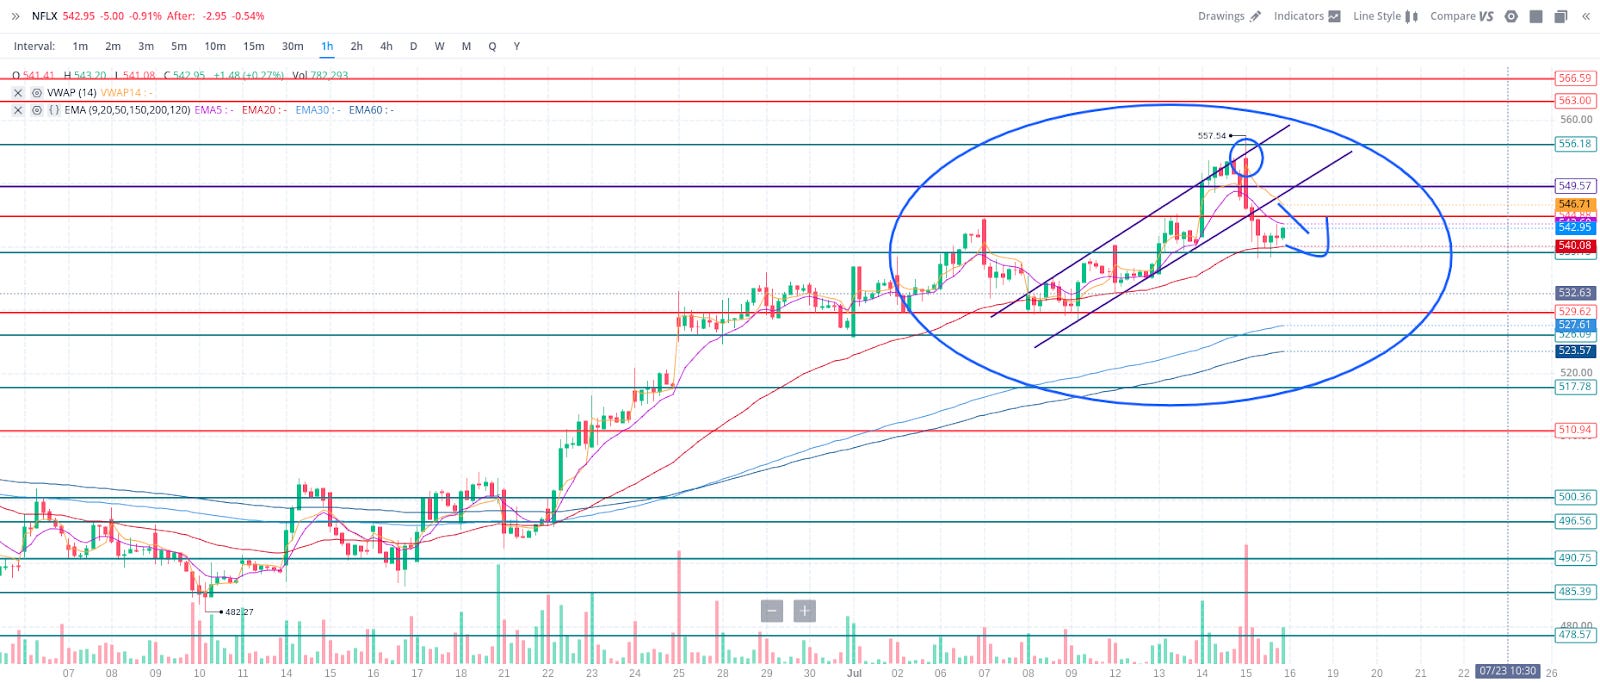
If you bought puts at the top of the NFLX trend channel and sold at the bottom? Tendies. If you held past the breakout? Wendy’s.
📺 Regular-ass Channels
Regular channels are easier to trade, imo, than the trend channels. You’re looking for the same type of lines that we learned in B.A.T 4: Support and Resistance—a flat range that the stock doesn’t seem to move below or above, using two or more points at the top and the bottom, respectively. Eventually it’s got to break out one way or another, but when it bounces off support or resistance it’s generally an easy swing as long as it’s within the channel.
So this:

Once you’ve patterned it out should look like this:

❗️NOTE: With channels you usually want to be looking at longer intervals like the hourly or daily (I just used the 3 min here because I was doing some cowboy shit mid-day.)
Double Tops (🐻 bearish) and Double Bottoms (🐂 bullish)
Very easy to spot and pretty self-explanatory. This represents multiple attempts by buyers or sellers to move past a certain point of resistance. Multiple rejections indicates buyers don’t have the volume to get past that point, leading to ⏪ reversal.
Double 2⃣ Top Example: BIDU

Triple 3⃣ Bottom Example: BIDU same session

🤑 So, these are fairly easy to spot and a very high percentage play.

⏩ Bullish and bearish rectangles: A Continuation Pattern
These are as simple as they sound—it’s basically a rectangle aka a channel. The key with these channels is that you’re looking for price action rising or falling definitively into it. Think of it as a channel with a handle. A bullish one looks kind of like a square flag, and a bearish one looks kind of like a fry-daddy. The price action moves into the channel, and then eventually continues in the direction it came into the channel with.
🐻 Bearish rectangle Example: ZM

That’s the tweet where I saw it, here’s the chart and what should’ve happened.


🐂 Bullish rectangle example: BLMN
BLMN was setup for a bullish rectangle continuation.
What happened:

Yeah, it ate shit during the huge red end of the week, BUT you see that, although brief, it did have the bullish upside breakout.
🔺🔻 Triangles: Ascending and Descending
Ascending triangles are increased buyer pressure with higher lows that should eventually allow it to break past resistance. This would mean buyers are beginning to take control. Descending rectangles? The same but opposite. Here we see an ascending triangle pattern on the PENN 3 min chart Monday.
🔺 Ascending Triangle Example: PENN

(❗️Note) it’s important to note that patterns, like supports or resistances, are less reliable on shorter intervals. They also don’t ALWAYS work. Let’s look at PENN a little bit later, which should head upward in an ascending triangle:

⭐️ BONUS: It’s also super important to keep track of the index when you’re looking for movement. For example. QQQ breaks downward out of its trend as PENN gets that sell pressure. This is where you combine your patterns WITH your support and resistance training, looking for a support or resistance to use with the preceding pattern theory.

⭐️ BONUS: Whoops—my chart was wrong WHAT DO I DOOOOOO?!?
Settle down there, spaz. Chart patterns only show you the probable outcome, not the guaranteed outcome. If they were guaranteed, everybody would just learn TA and become a billionaire until they decided they were bored. If your chart pattern breaks down, you can rely on your support and resistance levels to show you how hopeless it is. For example…
Example: PENN breaks downward out of it’s ascending triangle here, which is supposed to actually be a bullish pattern. Uh-oh. Well, luckily for us this happens near a support level—if it breaks down past it (red arrow) we know to sell, but if it heads back up we can exit as it reaches the bottom of the trendline it was in (blue arrow).

🔶 Wedge Pattern: Rising and Falling
⏪ Wedges are a reversal pattern where the breakout tends to happen at the APEX—or point where the slopes are about to meet. It generally heads the opposite direction of the wedge trajectory.
Descending Wedge (bullish): HGEN
Here we see HGEN with a textbook upward breakout at the APEX of the falling wedge.

⭐️ Wedgie Bonus: Wedges nearing support
I LOVE this combo, because it really makes me confident; when you have a wedge approaching a nice, strong support or resistance (think important, round numbers) it’s a great time to use this reversal play and time the apex. Take this ETH play, for example:


The falling wedge (bearish) hit its apex right near support. So, I had a strong hunch it would breakout upward soon.
🙏 The expectation:

✅ The reality:

ETH bounces off both the support and the apex of the wedge. This is a high confidence look to me.
Rising Wedge Example: BIDU following the downward breakout as it should:

This is part 1 of pattern spotting, and we’ll get into some more patterns (like cup and handles) next go round. As always, take it slow and and just try to work them in as best you can to your trading. B.A.T. has thrown a lot at you, so we may take a break for review next week, decide to look at some other trading tools...or just keep the party going. We’ll see lol.
As always, for questions or recommendations on what to do next, get at me!
📃 Pt. 4: Paper Chasing
Written by: @careerlow
Paper Chasing- Using Retail Tools to Show You Where the Money’s FLOWing
IF U R STILL READING THIS, IT MEANS U MADE IT OUT ALIVE…And you should consider yourself lucky, because we lost a lot of good YOLOers out there in the chop. I for one couldn’t even look myself in the mirror until the obscene amount of worthless 7/16s disappeared from my port overnight, like all those empty calories I eat right before bed.
So it seems Birdman going to keep BRRRRing, while signs of a future clappin’ coming to the market are popping up everywhere. Most of the global population believes inflation is in fact not transitory, but can anyone actually predict what is going to happen? There is no crystal ball, so all you can do is manage your own risk accordingly.
But I came here today to yet again inform you that there are publicly available tools that retail traders can leverage to try and make more informed judgements on what YOLO will salvage their “trading careers”. I’ve been using some of these tools to track the money FLOWs (with mixed results) since the ole’ Shuffle days and have done my best to identify some potential trends that I hope you might find useful.
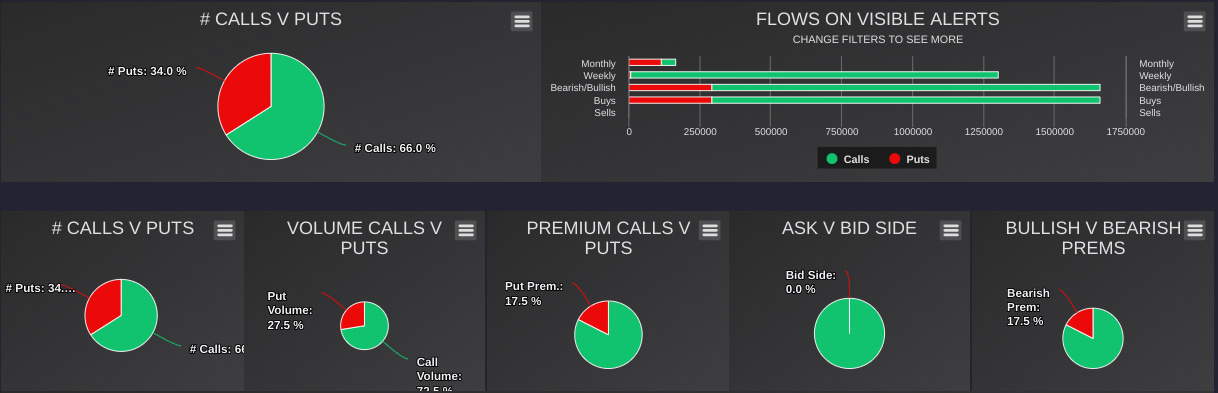
Along with the invaluable FLOWs from Unusual Whales that Milt should have drilled into your head by now, we are in the midst of filing season when everyone and their mother wants to know if Dr. Burry doubled down on his TSLA puts in Q2. 13F’s are dropping left and right from all of your favorite investment funds and are often used to try and identify some potential indicators. I’ve been using another fantastic retail focused tool you may know called Whale Wisdom, which allows anyone to pull the latest 13F filings to see what investment funds have bought, held and sold since the previous quarter.
It’s important to mention that these new filings were transactions placed up until the start of Q3, so there is a strong possibility that at least some of the filer’s positions have or will change in the near future. But these filings are often highly sought after leading up to release and can have a market impact on sentiment at both the sector and individual stock level. Using a combination of these tools available at your fingertips can help confirm your misguided bias that the money is indeed still flowing in your direction.
Exhibit A below shares some data for the total amount of 13Fs tracked by Whale Wisdom during Q1 (over 5,800), broken down into total investment percentages by sector. For comparison I have also shared the most up to date total 13F investment sector percentages for the filings that were uploaded to the site thus far. Keep in mind that only a fraction of total Q2 13Fs are currently tracked on Whale Wisdom (over 500 as of 7/16) as more will continue to filter in during the coming weeks. This could mean that we may see more fluctuations in the percentages by sector until the last 13F is dropped. I’ve already seen quite a few fluctuations the past two weeks.
Luckily with the new Sector Flow tool (Exhibit B) provided by Unusual Whales you can continue to track daily, weekly and monthly money FLOWs in and out of each sector in real-time (or be lazy until my next write up). You can even use this Sector tool to track FLOWs for some of the more popular stocks within each sector, or keep your eyes on daily stock and ETF alerts.

Don’t worry, after all that rambling you’ve obviously ignored I’ll still happy to share some insights from the funds I’ve been tracking. I’ve been making an effort to try and identify (manually) the most common holdings for some of top funds (as rated by Whale Wisdom) that have a 13F uploaded for Q2 thus far so be on the lookout for Milt to start dropping some FLOWs once we have enough conclusive data available. You could also, you know maybe even try showing some initiative of your own for once and checking out some of the awesome new tools bestowed upon us by Unusual Whales?
👀 Pt. 5: The Whale Watchlist Picks
Made possible with help from the @unusualwhales Alerts and Flow Tool. Sign up here!
Please note: with such a red day Friday, it’s nearly impossible to tell what is bearish activity and what is a chase. That being said, I’ve decided not to include puts in case it’s just a chase, and instead have focused on tickers that had green flow even as they/the indexes dumped.
I will update put charts and flow this coming week on my Twitter, and probably in a YEETlet for subscribers.
Whale WatchList:
📞Calls: ⭐️UBER, ZM, NIO, TTD
🎲 Degenerate Bonus (high-risk): SNAP Earnings (Calls)
👿 Puts: None
⭐️ = Milt’s Pick
1. UBER Calls ⭐️
I like the stock, the flow, and the chart. The watchlist is tech heavy this week, and this is about as close to “Reopening plays” as I got, lol.
🐳 UBER: Unusual Whales Alert

🌊 UBER: Flow reading

📈 UBER: Flow Chart

📉 UBER: Chart
Headed down in a trend that it has to bounce from at some point. 46 support here looks good, but you can hold out for 45.65, 46, 44.84

2. ZM Calls
ZM had a good day on a bad day Friday. Analysts are starting to say buy the dip and hell, I believe them. With bullish flow and a chart at a fairly predictable support, I’m looking to add.
🐳 ZM: Unusual Whales Alert

🌊 ZM: Flow reading

📈 ZM: Flow Chart
📉 ZM: Chart
Completed this bearish wedge in textbook fashion:
Now we’re looking to see if it breaks through 265. If it does all aboard to tendietown.

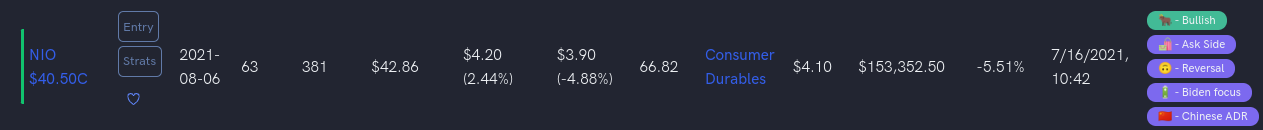
3. NIO Calls
Chinese company? Yep. Beaten to shit? Mhm. Bearish chart? Oh, yes lawd. Yet and still, I am a sucker for absurdly bullish flow against very bearish price action. The bullish flow on Friday as the stock fell 2% after a brutal run over the past couple weeks means a possible bottom to finish. I got slaughtered last week so I’m going big or going home with this one.
🐳 NIO: Unusual Whales Alert
🌊 NIO: Flow reading

📈 NIO: Flow Chart

📉 NIO: Chart
Daily: Working on a head and shoulders, so if considering entry, be VERY cautious and only consider at supports. I’ll post levels on twitter before Monday open.

4. TTD Calls
They have a whole lot going on including new services, a CEO running his mouth to every outlet about their future plans, and of course being a Cramer favorite. But who cares about all that—they had incredibly green flow on a shitty index day as they slid 2%.
🌊 TTD: Flow Reading
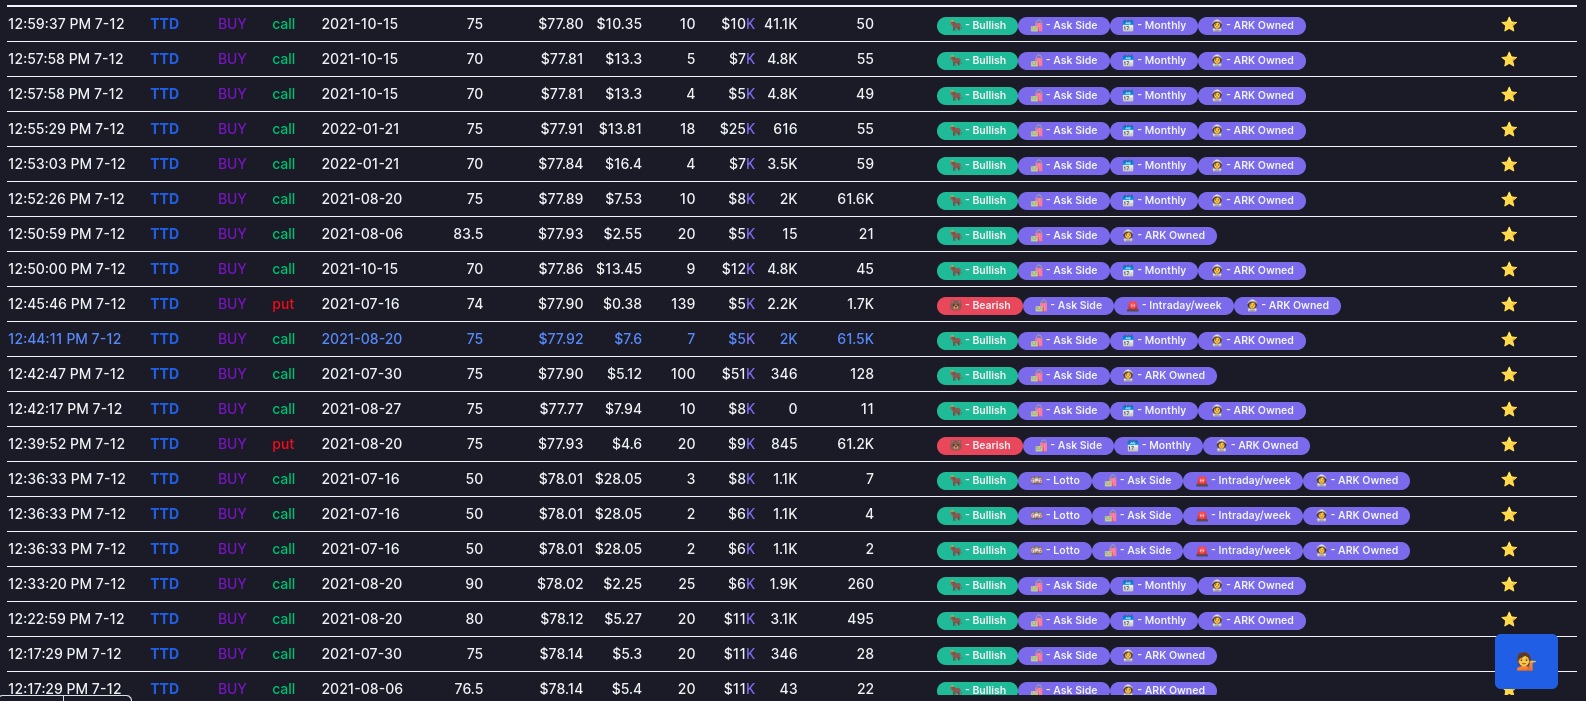
📈 TTD: Flow Chart

📉 TTD: Chart
The bearish pennant from the hourly played well here:


5. 🎲 BONUS: SNAP Calls (❗️Earnings❗️)
IF I played earnings, I’d say SNAP looks pretty tasty at these levels.
IF I played earnings, I’d say that the flow looks great.
IF I played earnings I’d say that the chart looks primed, and this is as good of a coin flip as you’ll get on tech earnings.
If…
🐳 SNAP: Unusual Whales Alert

🌊 SNAP: Flow reading

📈 SNAP: Flow Chart

📉 SNAP: Chart
Inverse cup and handle on the hourly looks done around 58.

Pt. 6: Weather: SPY & QQQ Forecast by @daarkmaagician 🌦
Below is the chart & info for a SPY & QQQ forecast from @daarkmaagician, his DISCORD is the place to be (YEETers get two weeks free!). I’ve attached his accompanying text as an image with the photo below.
SPY/QQQ Charts Legend:
Solid Blue= ATH, Green= Dark Pool Buys, Red= Dark Pool Sells, Purple= Dark Pools, Orange= Supports/Resistances, Teal= 9ema
📈 SPY FORECAST CHARTS:
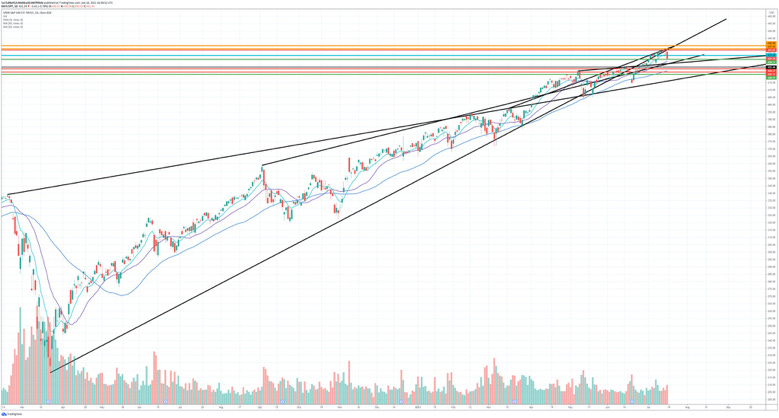

📈 QQQ FORECAST CHARTS:


Make sure you follow @daarkmaagician to get updates on the indexes daily!
Pt. 7: TLDR & GOODBYE ✌️
TLDR:
Pt. 2: Steel DD
Pt. 3: B-A-T 5: Spotting patters on charts
Pt. 4: 13F Filings research
Pt. 5: The Watchlist—⭐️UBER, ZM, NIO, TTD
Pt. 6: Dark’s Spy & QQQ Forecast
Goodbye and thanks for reading! Questions, scoops, comments @yourboymilt or /u/alldatdalton. See you next week! ✌
Thank you for making it easier for this Combat Veteran to understand. Looking forward to more great content.
Beautiful content, snap FD’s look delicious