

🔫 YEET no 18: Skyfall
🔫 YEET no 18: Skyfall
Welcome to The Yeet, a weekly DD where we try to tilt the casino...

Hey! I’m @yourboymilt, and welcome to retail’s Sunday Paper.
I should probably let you know...This is not financial advice! We are here to entertain while giving you ideas, perspective, and angles. Do your own research, I prithee. And if you aren’t subscribed, join us here:
Creator/Editor:@YourBoyMilt The Architect: 🧠 Publishing Associate:@YourGirlRachie
Pt. 1: Week’s Thoughts, Pt. 2: Tales From the Crypto 2 (SourMilk & Capybara), Pt. 3: Build-A-Trader (B-A-T) 7: Volume 101 (@modal_enigma & @dudue180), Pt. 4: Do Hedge Funds Beat the Market? (@mkt_sentiment), Pt. 5: Watchlist (The ‘It’s Ready’ Ryders Collective), Pt. 6: Index Forecasts (@daarkmaagician ) Pt. 7: TLDR
Pt. 1: Skyfall
The name’s Powell. Jay Powell.

A sworn patriot, a dutiful agent of the Market’s agenda, an unyielding force of ingenuity and courage who continually and patriotically saves the market—even when the economy says it doesn’t deserve it. Jerome’s acrobatics in battles with international portfolio threats have left our man scarred, beaten, and battered…but the functionality of the Market has stayed protected.
Inflation? Finally defeated with the weapon of his calming rhetoric, keeping the market afloat until this week when “transitory” became reality:
Concerns about inflation are also receding after a Wednesday data release on consumer prices for July showed a decline on a monthly basis, dropping to 0.5% last month from 0.9% in June.
*Judi Dench voice* Nice work by Agent Powell, but could $SPY’s spy succeed in defusing a bomb? Especially one as threatening to the nation as U.S. consumer sentiment numbers reporting RECORD LOWS this week? Well, those numbers—and their potential effects—were put down by our Agent with the muted swiftness of a GoldenEye silenced PP7.
U.S. consumer sentiment dropped sharply in early August to its lowest level in a decade, in a worrying sign for the economy as Americans gave faltering outlooks on everything from personal finances to inflation and employment, a survey showed on Friday.
Sacrifice after sacrifice, victory after bloody victory, you’d think that Powell would be lauded by Queen and country for his role; that of an effective and understated national guardian keeping our portfolios safe from the trenches. Yet there is already discussion of his potentially being discarded when his term expires in 2022, even after such heroic feats as a legend who survived Covid’s trial by fire.
Some think Mr. Powell’s Fed has been too weak on bank regulation and want the central bank to play a more prominent role in addressing the risks of climate change. Mr. Powell has argued that the central bank would imperil its political autonomy if it wades into hot-button policy fights where U.S. voters and lawmakers haven’t reached a consensus.
Sen. Elizabeth Warren (D., Mass.) slammed Mr. Powell’s record on easing regulation. Sen. Sherrod Brown (D., Ohio), the chairman of the Senate Banking Committee, which will oversee the confirmation of the next Fed chair, issued similar criticism of Mr. Powell. Both declined to say whether they would support or oppose a second term.
Ouch. It looks like my monthly contracts aren’t the only thing that may see their term expire worthless.

But dispensability is the cost—and damage the expectation—for one whose primary duty is keeping a country afloat, fighting the deeper battle in the shadows. There are no public ceremonies lauding Jerome’s backroom agreements, no commendations recognizing his clandestine guidance of the Plunge Protection Team, no statues outside of Federal buildings celebrating his unflinching commitment to buy all the bonds.
Perhaps that ingratitude—an under-appreciation of work that is simultaneously manipulative and effective—is what’s driving more and more agents of the Fed to go rogue. Each week the number of officials spurning Mother Market to speak truth to power grows, leaving Powell as the only one at the podium battling inevitable truths with his weapon of choice—his microphone. This week it was Kaplan, next week…who knows?
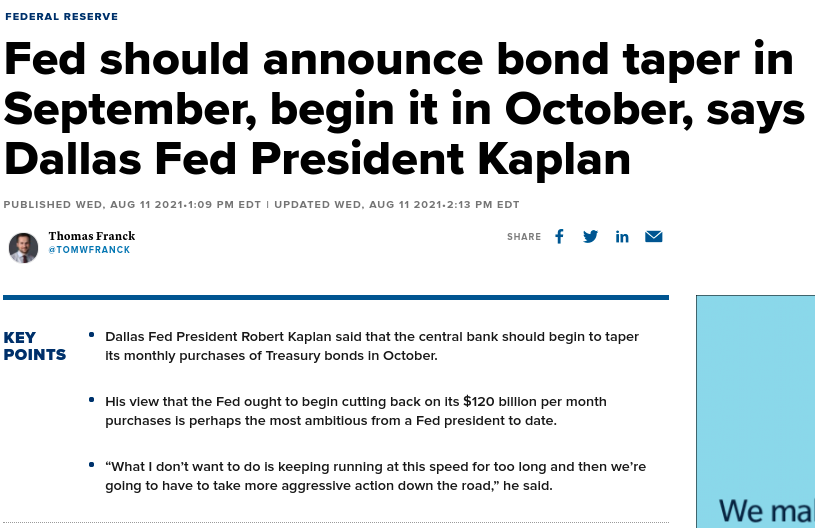
September! September is in, um, two weeks? And my AAPL LEAPs expire when?! Getting us out of this mess is going to take all the gizmos and gadgets that Mr. Bond—Treasury Bond—has at his disposal.

Well, if you thought you’d seen our man Jay save us from the clutches of certain national travesty so far, this week will be the ultimate test. The walls are closing in—in three perilous ways—and it will take some combination of cloak & dagger (numbers being reported), a way with words (FOMC minutes dropping), and brute strength (surviving OPEX on Friday) for account blow ups to be defused across the country. My God…it’s an issue of national security. Our week ahead:
Investors will also take in a slew of economic data including retail sales, industrial production, capacity utilization, business inventories and the NAHB's home builders index.
And:
On Wednesday, the Fed will release the minutes of its last meeting. While that is viewed as old news, the release will be highly scrutinized for more details on the “tapering” process.
And of course, the kicker:

In a market shaken and not stirred, we don’t know where home is; whether we are still fully bullish, or flirting with bearish, or firmly in the jaws of an endless, looping sector rotation. For civilians it’s impossible to know what’s up and what’s down; good economic numbers are bullish, then bearish, then magically they’re bullish again. We’re led by a Fed which can’t even decide among themselves which direction they’ll guide us, leaving our “investment strategies” as scattered as rounds from an SMG. Memes lurk simultaneously submerged and obvious, creeping like double agents in plain site, effortlessly distracting retail from the clear shots ahead.

Skyfall was Bond’s home, the formative orphanage from which a fictional character grew to complete daring mission after daring mission to save a world gone mad. It was eventually consumed by fire as the British government was consumed by chaos, and from the ashes of both a stronger agent—and safer nation—were born. Our market is a nation-state constitutionally bound to the Covid-created doctrine of quantitative easing, and Jerome is its battered, derided, and unflinchingly loyal agent. Maybe our fire will be an ‘unexpected’ correction that lets both begin fresh, forcing investors to relive future’s past with a return to fundamentals and calm. Sometimes, it’s hard to know the difference between bearishness and a longing for necessary rebirth. And, sometimes, it’s just as hard to know the difference between bullishness and pouring water on something that needs to burn.

Welcome to YEET no. 18, brought to you by The $SPY Who Loved Me.
🪦 Pt. 2: Tales From the Crypto 2: THUD & Alt Plays
Contributors: SourMilk & Capybara
Welcome back, Yeeters!!
The strange activity persists here in Crypto this week—we’re thinking it could be something in the water. Side note—Rainbowtrout69 did a lil’ name change to Capybara—we just wanted to make sure you knew who to direct all complaints to. Anyway, back to actual Crypto news—Ethereum’s steady climb continues! We’ll share what’s been on our minds in the space, and then yeet some sweet altcoin entries & PTs so you know when to leverage 100x on Cryptos you’ve barely even heard of. We know you want in!
We also couldn’t stop thinking about this “did ETH save BTC?” question we posed last week. We knew we needed to chart back some months, but what do we call this...hypothesis? We thought long and hard, and two tries and 5 minutes later we finally got it; it shall be named The Ultimate Divergence (“THUD!” for short). To pull this theory off we’re going Back to the Future, and checking the stats in April before taking the DeLorean back to the present day, our Hard Fork Hot Summer. Yes, things are gettin’ seasonal up in this bitch and...do we smell...an obscure Yeet Speedo line coming for those mask-filled, socially distanced summertime pool parties?

The Spring THUD!, huh? We need to take a trip way way wayyyyyy back to relive some of the most riveting price action EVER; to understand the future without a Flux Capacitor, we gotta take a minute to review what the heck happened in one of the largest divergences Crypto has seen in years. So come ride with us!
(Oh yeah, PS...our Speedo line? We’re calling it the Hard Fork baby! Available in stores EVERYWHERE—or nowhere—Nevuary, 32nd)
These are the important dates:
April 14th 2021 - Entire Crypto Market Cap ATH of $2.26T (April 16th, technically)
BTC reaches ATH of $64,899
ETH sits proudly around the $2,400 mark, it’s proven itself above $2K for a couple weeks now, but along with the rest of the alt market, things have been mild as BTC approaches the end of its runway.
April 22nd/23rd - Market Cap has tumbled to around $1.8T (down 21% from ATH)
BTC is weakening but holds above $47K - Death-Cross on 4HR
ETH drops to a cozy support at $2,100 after a hard rejection at mid $2,600s. It stops, almost perfectly in sync with BTCs Death-Cross - then quietly it sucks rocket fuel out of BTCs last bit of spirit...and...
ETH begins a shocking, unstoppable 19 Day-Fuck-Y’all-Ascension that takes it over +100%! It will see only 4 mild red days in this span, as it climbs to an ATH of $4,384 on May 12th. Alts surge in waves, but 2 or 3 baggers were commonplace for anything purchased at the beginning of April - it was a profit paradise for confident bulls.
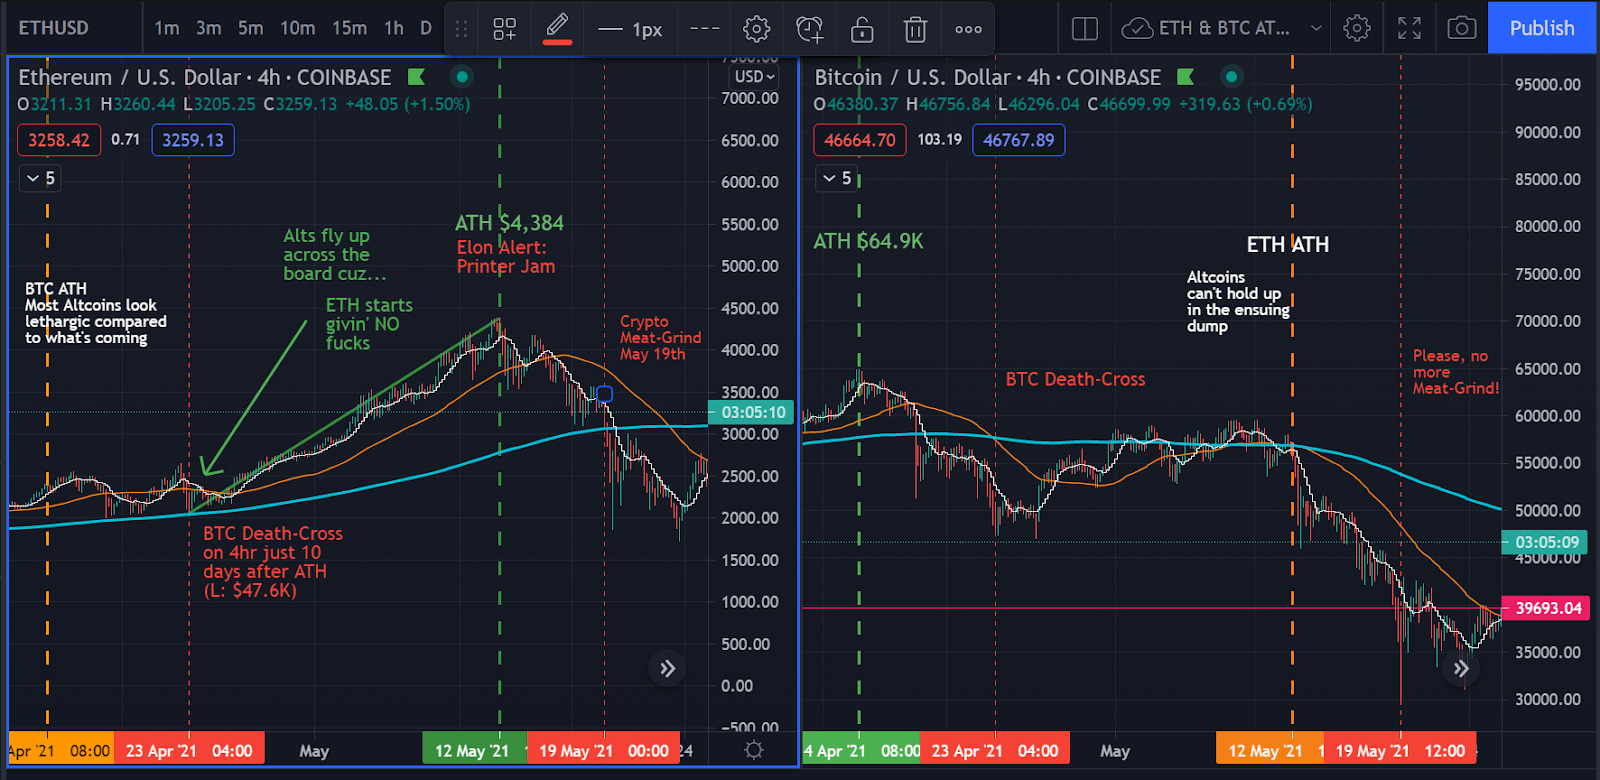
May 12th -Total Market Cap Balloons to ATH = $2.48T (almost 9% higher than BTCs special day a month prior) - Crypto sat atop the world with an Ethereum snapback crown and said, “Fuck literally all y’all securities”. Cryptos Market Cap surpassed that of any publicly traded company in the world, ever. Imagine Warren Buffett, lol. (Not even doing anything, just imagine him reading that news over his McDonalds).
But then at 22:00UTC…Elon Musk Tweets that Tesla will be suspending their acceptance of BTC as payment. In practice, it’s just about meaningless.
The market reacts immediately. It tanks. Fucking. Everything.
ETH dives to close -13% around $3,800.
BTC is comparably bear-torn, closing -14% at $49,500.
BTC & ETH by themselves chopped around 200B off the market cap in a single day, which closes -16% at $2.15T
It was just a hiccup though, we recovered quick! Hahah just kidding, it was so fucked.
May 19th - The National Hamburger Month Crypto Meat-Grind. Crypto's Total Cap plummets as far as -40%, but scrambles like a rat churning burgers to close at a tasteful -23% ($1.55T). In just one week, an all-electric-mega-bear just rips on fear. Nearly 1 TRILLION dollars, pulls out of the Crypto-Casino.
And yes, May really is National Hamburger Month. (you’re welcome)
The Delorean has made it through the spring and we’re almost back to the present--but first we’re making a stop in July! In the fast moving world of Crypto, you just journeyed back ages ago...almost 3 months! We wish we could fill in the gaps between where you just were and where we are now, but there’s not enough space on the page - so just accept you’re now in July and don’t ask too many questions. Then, in the same stroke, we’ll bring it to today - where the charts whispered to us about a bullish save nearly three weeks before the Forkin’...wanna see?
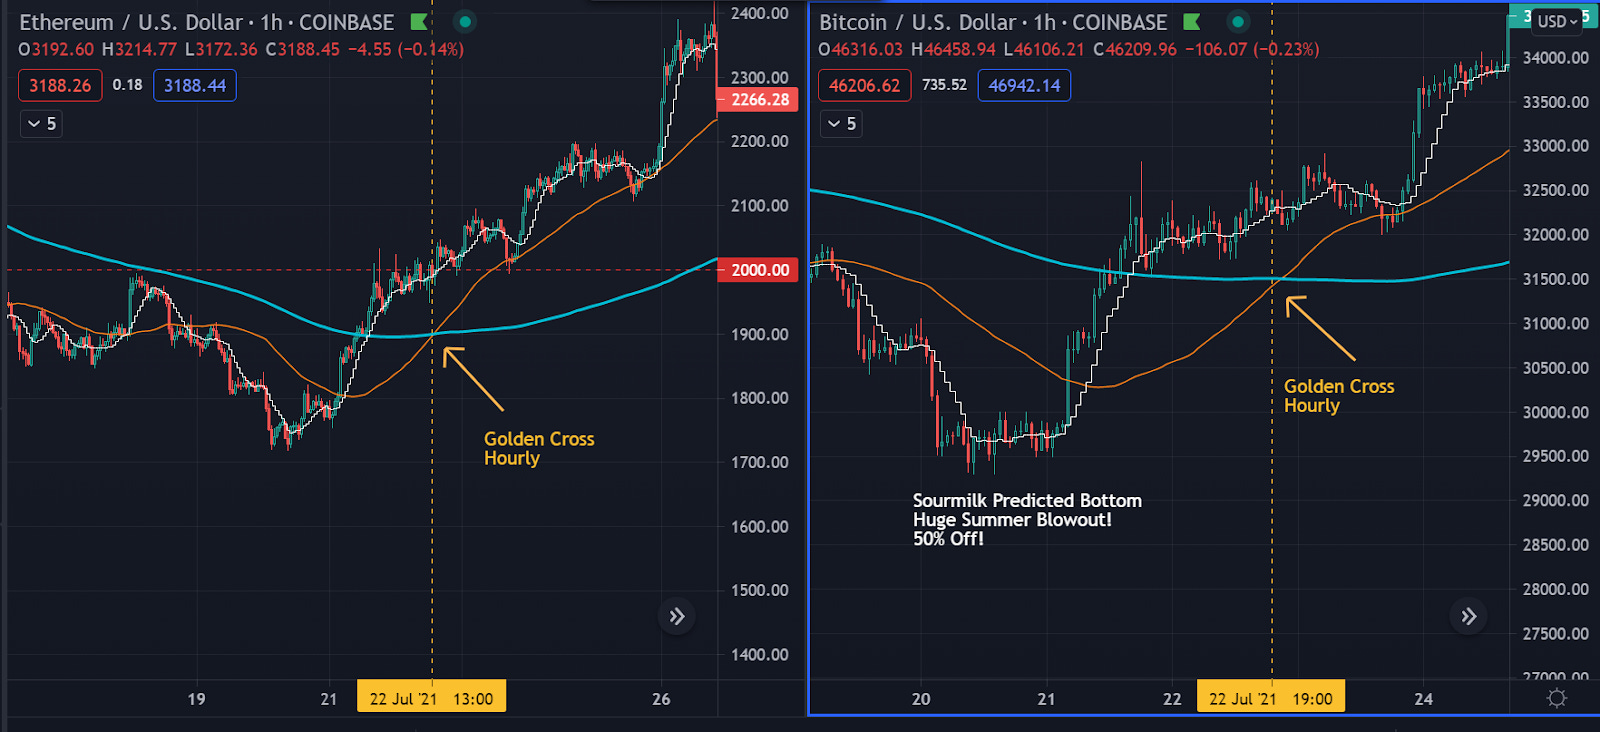
(Almost) Simultaneous Golden-Crosses:
July 20th: Sourmilk’s predicted bottom, best buy opportunity in months (he earned two gold stars for this one).
July 22nd (BTC & ETH Golden-Cross on hourly).
ETH Golden-Cross @ 14:00 UTC (THUD! Ethereum flashes the indicator before BTC!)
BTC follows suit to Golden-Cross 7 hours later @ 21:00 UTC
It’s been almost nothing but upside throughout the whole market since the 22nd.
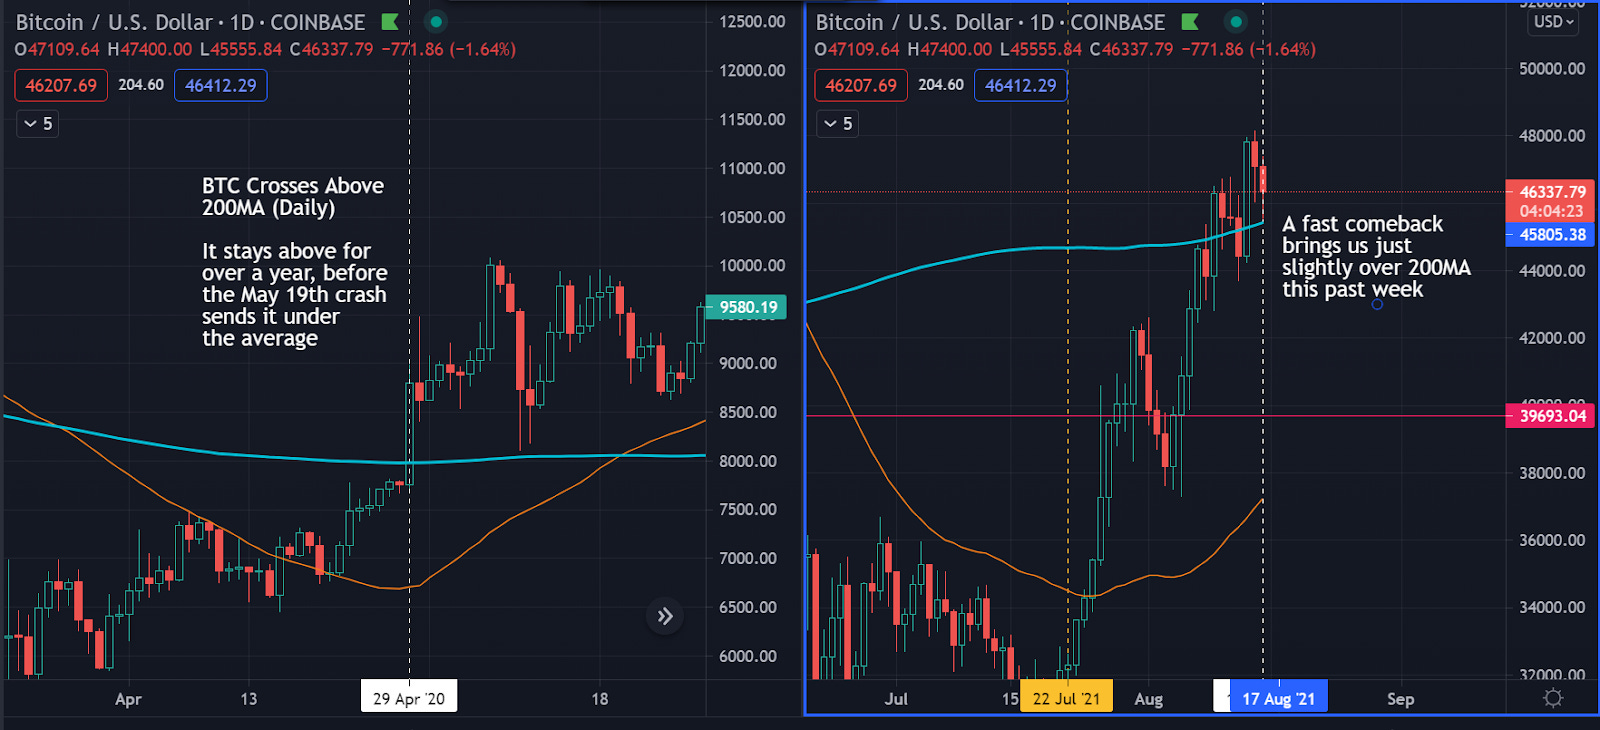
Side Note: The last time the price of BTC passed above 200ma was in April of 2020, as it broke past $8K. Just this past week it did so yet again - it’s now testing on the low end.
You’ve heard a compelling case for THUD! And now you might be thinking “you guys are silly! Last week you said BTC is the boss, but ETH is driving now”. And you’d be right, we are silly. But, our trading theory still revolves more around using BTC as a gauge for short-term swing indicators. ETH has led the charge in some monumental breakouts and we always have an eye on it, but BTC, we feel, is still the one to watch when you’re looking for entry into sweet swingin’ alts...which we’ll be getting to right now!
Swing Time: Ethereum and Bitcoin are cool, but psst psst . . . you ever tried some Alt coins?
We’ll highlight some plays that show serious upside and are begging to be adopted into your Crypto portfolio.

Bitcoin Cash (BCH)
Tip your fedora to Bitcoin’s quicker thinking, but a bit pretentious younger sibling. “We need to connect back to like, our roots, man”....You know the type. Bitcoin has a history of Hard Forks birthing new Cryptos, Bitcoin Cash in August of 2017 and Bitcoin Gold (BTG) in October of the same year are the most notable. Users of Bitcoin were becoming frustrated with the slower payments and higher fees that were associated with using regular Bitcoin. So what did developers do? They created Bitcoin Cash. It sought to re-fulfill Bitcoins original purpose: fast payments and low fees on a decentralized network. It has now become a more realistic approach for day-to-day payments, while BTC, as we know, has become a store of value - and a totes-fave-buzzword to keep boomers believing their brokers totally know the internet now! Tiktok, Bitcans, and NFT Tokens are hip!
Flex bonus: if you buy some BCH you can tell your friends you own a couple Bitcoin cash. Do it often, they’ll love it.
Here is a quick snapshot of Bitcoin Cash on the daily
Entry prices that we like (green) and price targets (blue)
Entries: 723, 691, 660, 645 605,
Targets: 765, 822, 866, 911, 947, 1000
FileCoin (FIL)
Over the past few weeks, we have looked at the prices of a number of Crypto and have been surprised that they were still so low given the moves that Ethereum and Bitcoin had been making. That surprise soon melted to dismay as the Crypto we were eyeing had ripped and we were left with our hands down our pants, “coulda shoulda woulda”. FileCoin is one of those Cryptos that’s been relatively dormant, but we believe is still at an attractive price and has huge upside potential. Its big run to $180+ occurred ahead of the April BTC run-up and that’s that shit we like.
What is FileCoin? Essentially, it supports a massive decentralized hard drive that is available for anyone to rent. FileCoin promises to bring the cost of data storage down while also improving the safety of online storage. Dropbox and iCloud both have histories of big hacks and data leaks, but FileCoin’s use of existing computers to create a large data network helps protect it from hackers.
OKAY cool right? But let’s be real, we want to make money, and the FileCoin chart got us droolin’.
Entries: 72, 70, 67, 64, 59
Targets: 79, 89, 99, 107, 135, 142
Internet Computer (ICP)
Yooo! Did the Insane Clown Posse really make their own Crypto? Unfortunately, they didn’t. But this pick is still pretty insane. ICP has a checkered history, but we’ll try to TLDR it for ya. ICP is a decentralized (common theme) network that is intended to run applications at web speed while processing data safely and efficiently. ICP aims to help various platforms run at a fraction of the cost compared to normal computing rates. ICP opened on CoinBase at over $600 but got slammed upon release, dropping nearly 90%. This is not abnormal for new coins releasing on CB (and exactly why CB typically gives very little notice on new additions). The company, DFINITY USA, was also hit with a lawsuit for selling ICP tokens while not being registered with the SEC. ICP is a risky play but the upside potential is enormous. Let’s take a look at the chart, shall we?
Entries: 64, 61, 58, 55, 53
Targets: 77, 91, 105, 119, The Stratosphere
Well you Crypto-hungry Yeeters, we just threw a lot of information at you and we hope some of it stuck. It’s a wild time in the market right now and it looks like things will keep up the frenetic pace in the coming weeks. There will always be the risk of the market taking a turn downward, but we are bullish on Ethereum and Bitcoin. Bitcoin’s ability to hold above 45K and Ethereum’s reclaim of 3K shows to us that there’s still a lot more upside for this market to claim. Before you jump in, make sure that you are comfortable with the amount of risk you are exposing yourself to and be patient with the market - prepare to stomach the dips. There will be bumps along the way but the future looks bright for Crypto bulls.
Good luck!
🦇 Pt. 3: Build a Trader (B-A-T) 7: Volume 101
Contributors: @modal_enigma & @dudue180
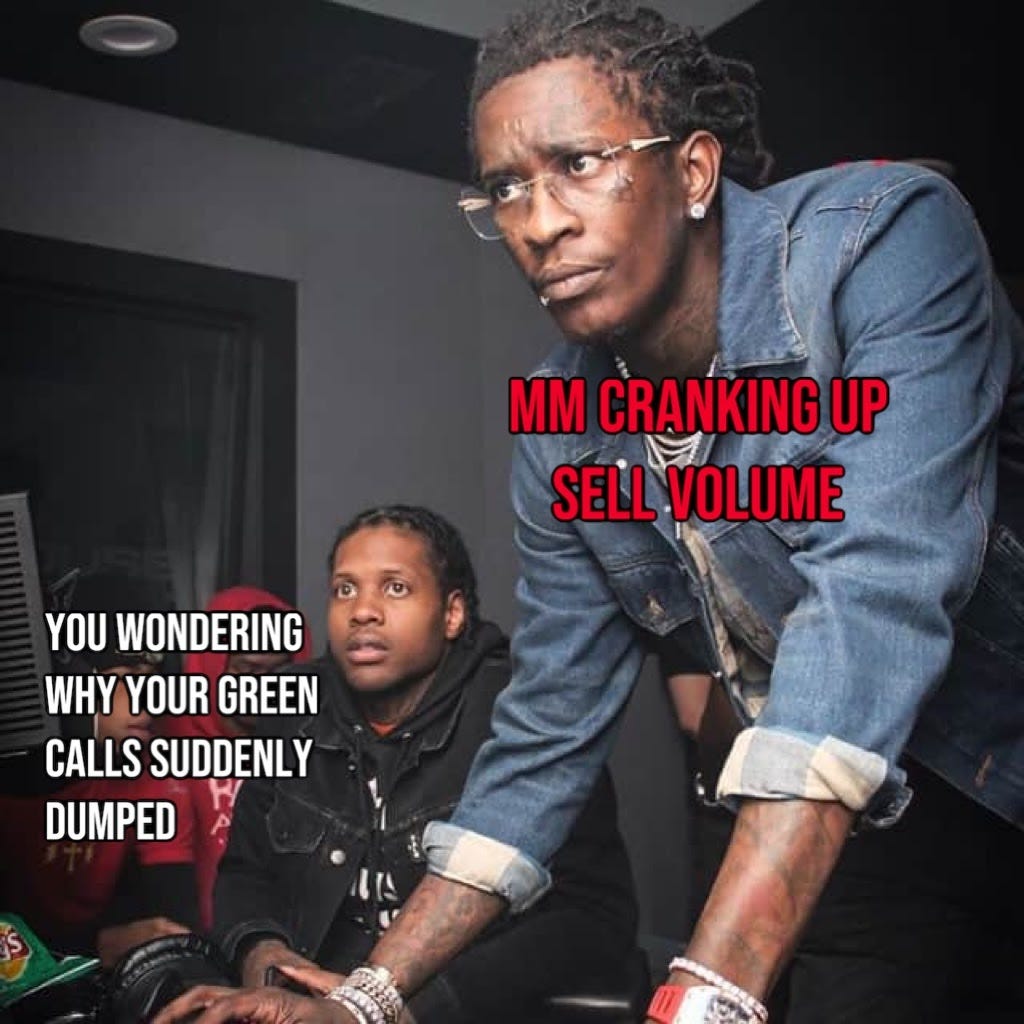
Have you ever jumped into a trade after seeing the price starting to moon, and then a few hours later wondered WTF happened to all the sweet sweet profits that you had just an hour ago? Or have you ever bought a stock that’s been showing a solid and steady move, and then one day you realize that you are down 30%, and are now a long term investor trying to average down to breakeven?
Welcome to Volume 101!
We’re here to try and minimize future bags. We’re kidding, you’ll still definitely be HOODWINKED by pump and dumps, rug-pulls, and blindingly fast sector rotations - but at least now you can feel better that you kind of tried to avoid them.
We’re going to break it down to basics, as I’m sure there are plenty of well-intentioned but utterly lost Apes still wondering what those little green and red vertical bars under a chart mean (it’s volume for the record). Put simply, volume is the sheer number of shares traded of an equity/commodity/option/future/etc… and it can tell us a surprising amount about what is going on with a stock. For the most part volume indicates liquidity in the traded market.
It shows where the REAL buyers or sellers are ready to step in and execute their buy/sell orders, and yes, we mean the big boys and girls: hedge funds, whales, retirement accounts, or our lord and savior RoaringKitty.
To be clear, unfortunately, your buys don’t do a damn thing to move volume; this is a bigger game. Did you think you can move the price with your measly 54 share buy order, or the 2 weekly 25% OTM gamb—excuse me, options contracts you get—can force the MM to buy shares to hedge?
I trust that you’ll someday have that kinda dinero, but today ain’t that day my friend.
When you see large volume, it is mostly institutional buy/sell orders who made the conscious decision to either dump shares on you (bag holders created) or help pump your options from 25% OTM to now being only 23% OTM. Volume giveth, and volume taketh away.
Now, you might be saying to yourself: “So what? I’m still going to YOLO my entire Wendy’s paycheck into some random stock that had 232K shares traded, of course based on a WSB DD that I only read half of.” Well, time to stop that thinking amigo; taking 5 seconds to give a simple look at volume can save you a lot of heartache.
🤷♂️ Why looking at volume is important:
Volume is necessary for seeing any real price movement
Volume is necessary for seeing true trends via T/A
T/A on a ticker that has a 200k daily volume, for example, means almost nothing
Looking at levels of volume over a period of time can reveal or confirm the start/end of a trend
Momentum (serious price movements) requires volume
Understanding volume and bid-ask spreads can help us understand market manipulation factors like “Sell Walls” or “Short Ladders”
Looking at volume can help prevent you from throwing money into illiquid stocks
Again, for the 1 banana gallery: Looking at volume can help prevent you from throwing money into illiquid stocks (👀 CLNE)
📢 Types: Buy Volume and Sell Volume
Here we go back to those tricky red and green bars we see below a chart – those are volume indicators (see the circle in the image below). You’ll see two types: buy volume and sell volume.
✳️ Buy volume:
People slapping the ask – buyers have control
Action is on the offer price aka “ASK”
Generally speaking is a driving factor in increasing share price.
Not always, but usually – this is where momentum plays a factor
🔴 Sell Volume
Sellers have control (sellers exceed buyers)
Action is at the bid price
Generally indicates downward price trend (again the above caveat)
🤔 The tricky part of looking at volume is that you have to remember that the color indicating buying/selling volume is based upon the percentage of volume in either direction for the time frame. The chart below is showing Friday’s DIS action at 10 minute intervals. That first big green candle of approximately 3.4 million shares means that there was more buying than selling in the first 10 mins, hence the green coloration. That doesn’t mean that it was 3.4 million shares bought, rather that over 50% of the shares traded in that 10 minutes where buys. If you want more detailed information you can go down to a 1 minute chart and get more detailed info.

❗️Pro TIP: If you don’t have volume enabled on all of your charts, this is where you stop reading and go fix that issue. If you are using a platform like Robinhood or SOFI or exclusively mobile, you can go to tradingview.com to look at some charts.
In our DIS example: If you look at the volume indicator, 3 things should be readily apparent:
1⃣ There was more selling than buying
2⃣ The volume slowly tapered off during the day until the last 10 mins of trading
3⃣ As that volume decreased and there was more selling than buying, the price decreased commensurately
This feeds into how volume can be used as one tool in your arsenal to determine entering or exiting a trade. Keep in mind that you can look at volume intraday as well as over a larger time span.
😏 How to use volume:
We write this section cautiously as there are many ways to use the volume indicator. Because there are very few true absolutes in the trading world, we write the following guidance in general terms to use a “rule of thumb”. Always remember that buyers, sellers, and Market Makers rule the market, not technical indicators. Things can change at the push of a button, or on the pre-programmed whims of an algorithm.
❗️ For all of the below, keep this in mind❗️:
Volume is a measure of commitment/momentum behind a stock price – gives legitimacy to the price action
Volume is relative to the average number of shares traded in a given time frame– look at longer term trends of volume, not just intraday
Low volume means that few people are trading it and interest is low
High Volume means there is exuberance or confidence in a stock
🌋 Volume and breakouts (or false breakouts)
Usually when the underlying is trading in a range pattern or near important key level (support/resistance) you should expect a move to occur. When the move (up or down) finally happens, high volume will confirm a successful breakout and high interest which will help to determine the short term direction. On the other hand: low volume on the breakout will indicate it was false and a lack of interest in the move.
🔀 Volume and Price Divergence
If you have price movement on relatively low volume, generally there is very little support of the price movement, which means that the trend is not likely to continue. A gust of wind (aka a few hundred thousand extra shares) can abruptly change the direction of price. After Hours or Pre-market trading is a good example of this. You can have a stock sitting 15% higher than the previous close, and high sell volume at open of regular trading can immediately negate that premarket move.
💲Price Exhaustion
After a parabolic or ‘falling of a cliff’ move with heavy volume, the underlying will normally consolidate (congrats Theta gang) with a declining and lower volume which can indicate a reversal in a direction or preparation for another big move in the same direction.
That’s it for Volume 101!
Yes it’s a lot, but we feel it’s an important indicator when looking at either taking home a bagger or being left holding the bags. Honestly, there is a lot more that can be written, especially when looking at volume in relation to other indicators – maybe that will be Volume 201 someday. Cheers, and make sure to add M-F#%$ing volume to your charts.
🥊 Pt. 4: Do Hedge Funds Beat the Market?
Article By: @mkt_sentiment
Editor’s Note from @yourboymilt: Whatsup guys! Our next contirbutor needs no introduction as you’ve heard from him before and you know he has the good shit. Deep dives on pertinent topics is what he does best, so check out this article on one group we all hate—hedgies.
To receive Market Sentiment’s newsletter in your inbox weekly, SIGN UP FOR HIS SUBSTACK!
Do Hedge Funds beat the market?
I analyzed the performance of 5000+ Hedge Funds over the past 24 years and benchmarked it against SP500. Here are the results!
Hedge Funds are a controversial breed of companies. On one hand, you have Michael Burry’s Scion Capital returning 489% shorting the housing market and on the other hand, you have Melvin Capital losing 53% of its investment value in 1 month following them shorting GameStop. Adding to this, most hedge funds have an eye-watering 2 and 20 fee structure -> What this means is that they will take 2% of your investment value and 20% of your profits every year as management fees [1].
Even with these significant risk factors and hefty fees, the total assets managed by Hedge Funds have grown year on year and is now over $3.8 Trillion. Given that you need to be an institutional or accredited investor to invest directly in a hedge fund [2], it begs the question.
Do Hedge funds beat the market?
Data
The individual performance data of hedge funds are extremely hard to get [3]. For this analysis, I would be using the Barclay Hedge Fund Index that calculates the average return [4] of 5,878 Hedge Funds. The data is available from 1997.
This dataset was also used by American Enterprise Institute in their analysis, so the data must be accurate. All the data used in this analysis is shared as a Google sheet at the end.
Result
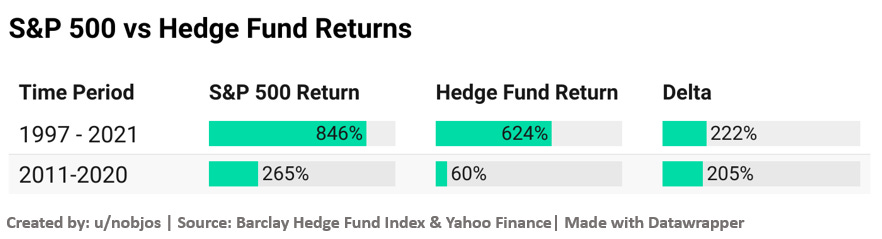
S&P500 has beaten the hedge funds summarily with it returning a whopping 222% more than the hedge fund over the last 24 years [5]. This difference becomes even more drastic if you consider the last 10 years. During 2011-2020, SPY has returned 265% vs the average hedge fund returns of just 60%.
This awesome visualization by AEI shows the enormous difference in returns over the last 10 years.

If you are wondering about the impact of this on the average investor (who will not be able to invest in a Hedge fund due to the stringent capital requirements), these above returns correlate directly with the returns of Fund of Funds (FOF). FOFs usually invest in a wide variety of Hedge funds and do not have the capital requirements required by a normal Hedge fund so that anyone can invest in it.
The catch here is that you will be paying the management fee for both FOFs as well as the Hedge Funds. This implies that your net return would be even lower than directly investing in the Hedge Fund. This becomes apparent as if you consider the last 24 years, on average FOFs (Barclay Fund of Funds index), returned 233.1% (~390% less than avg Hedge Fund) vs SPY returning 846%!
Warren Buffet’s take of Hedge Funds
In 2007, Warren Buffet had entered into a famous bet that an unmanaged, low-cost S&P 500 stock index fund would out-perform an actively managed group of high-cost hedge funds over the ten-year period from 2008 to 2017 when performance was measured net of fees, costs, and expenses. The result was similar to the above with S&P 500 beating all the actively managed funds by a significant margin. This is what he wrote to the investors in his annual letter
A number of smart people are involved in running hedge funds. But to a great extent their efforts are self-neutralizing, and their IQ will not overcome the costs they impose on investors. Investors, on average and over time, will do better with a low-cost index fund than with a group of funds of funds.
Performance comes, performance goes. Fees never falter
While I don’t completely agree with this view that it’s impossible for Hedge Funds to beat the market (The famous Medallion Fund of Renaissance Technologies[6] have returned 39% annualized returns (net of fees) compared to S&P 500‘s ~8% annualized returns over the last 30 years). But, it seems that on average Hedge Funds do return lesser than the stock market benchmark!
An alternative view
It would be now easy to conclude now that Hedge funds are pointless and the people who invest them in at not savvy investors. But,

given that the investors who invest in Hedge Funds usually are high net worth individuals having their own Financial Advisors or Pension Funds having teams of analysts evaluating their investments, why would they still invest in Hedge Funds that have considerably lesser returns than SPY?
The answer lies in diversification and risk mitigation.
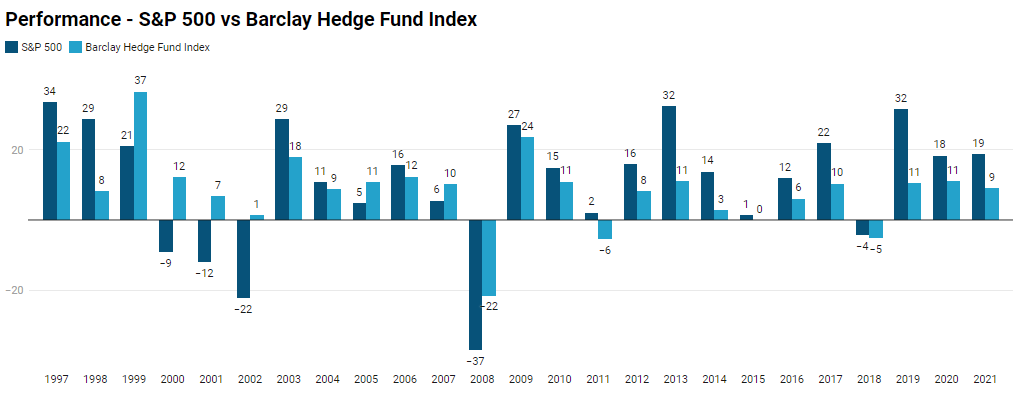
The above chart showcases the performance comparison between S&P 500 and Hedge Fund over the last two decades. We know that SPY had outperformed the hedge funds. But what is interesting is what happens during market crashes.
In the 2000-2002 period where the market consistently had negative returns (Dotcom bubble) in the range of -10 to -22%, hedge funds were still net positive. Even in the 2008 Financial crisis, the difference in losses between SPY and hedge funds was a staggering 15%.
This chart also showcases the important fact that most hedge funds are actually hedged pretty well in reality [7]. We only usually hear about outliers such as Michael Burry’s insane bet or how Bill Hwang of Archegos Capital lost $20B in two days which biases our entire outlook about hedge funds. To put this in perspective, over the period from January 1994 to March 2021, volatility (annualized standard deviation) of the S&P 500 was about 14.9% while the volatility of the aggregated hedge funds was only about 6.79% [8].
While you and I might care about the extra returns of SPY, I guess when you have 100’s of Millions of dollars, it becomes more important to conserve your funds rather than to chase a few extra percentage points of returns in SPY.
Conclusion
I started off the analysis with the expectation that Hedge Funds would easily be beating the market so as to justify their exorbitant fee structure. As we can see from the analysis, on average they don’t beat the market but provide sophisticated methods of diversification for big funds and HNI’s.
Even if you want some effective diversification, it would be much better to invest directly with established hedge funds rather than going for Fund of Funds as with the latter, most of your returns would be taken by the two-tiered fee structure.
What this means for the average investor is that in almost all cases, you would get a better return on your investment over the long run by just investing in a low-cost index fund. Replicating what pension funds and HNI’s do might not be the best strategy for your portfolio.
Footnotes
[1] To signify the impact of this fee, let’s take the following e.g. if you invest $100K into a hedge fund and at the end of the year, your fund grows to $120K, they would charge you $2K (2%) + $4K (20% of the profit) for a total of $6K. Even if they lose money, they will still charge you $2K for managing your money. Vanguard SP500 ETF would charge you $30 for the same!
[2] Minimum initial investments for hedge funds usually range from $100,000 to $2 million and you can only withdraw funds when you’ve invested a certain amount of money during specified times of the year. You also need to have a minimum net worth of $1 million and your annual income should amount to more than $200,000.
[3] Barclayhedge provides data for the performance of individual hedge funds but it costs somewhere between $10-30K. I like you guys, but not that much :P!
[4] The returns are average not weighted average based on the asset under management so it’s representative of the individual returns of the Hedge funds and does not bias the analysis due to the size of the Hedge Fund.
[5] Please note that the SPY returns are not net of fees. But this would be inconsequential as a low-cost Vanguard index fund has fees as low as 0.03%. The returns shown for hedge funds are net of fees.
[6] To put the performance of Medallion Fund in perspective (its considered as the greatest money-making machine of all time), $1 invested in the Medallion Fund from 1988-2018 would have grown to over $20,000 (net of fees) while $1 invested in the S&P 500 would have only grown to $20 over the same time period. Even a $1 investment in Warren Buffett’s Berkshire Hathaway would have only grown to $100 during this time.
[7] For e.g., some hedge funds by inexpensive long-dated put options that hedges against a sudden market downturn. While this would ultimately make their net return lower in a bull market, in case of a huge crash, they would still be positive. This article discusses more on fat tail risks in the market and how hedging is done.
[8] The volatility is calculated using Credit Suisse Hedge Fund Index.
As always, please note that I am not a financial advisor. Hope you enjoyed this week’s analysis.
If you found this insightful, please share it with your friends :)
WhatsApp | Facebook | Twitter | Reddit
👀 Pt. 5: The Whale Watchlist Picks
Made possible with help from the @unusualwhales Alerts and Flow Tool. Sign up here!
Contributors/Tipsters: The “It’s Ready” Ryders
Twitter recs: @suitntieagent (WBA), @monkey18tech (WBA), @kipinvestments (CRM)

Whale WatchList:
📞Calls: ⭐️MCD, CRM, WBA, XLE, FB
👿Puts: none on OPEX week? Oh, my!
🎲Earnings Gamble: LOW puts
⭐️ = Milt’s Pick
1. MCD Calls⭐️
I cannot say enough about this company. Not the stock—the company. BEST breakfast in the game. BEST fries in the game. ONE DOLLAR any-sized soda. Oh and uh, yeah, I guess the setup is great or whatever. It’s ready.
🐳 MCD: Unusual Whales Alert
None recent
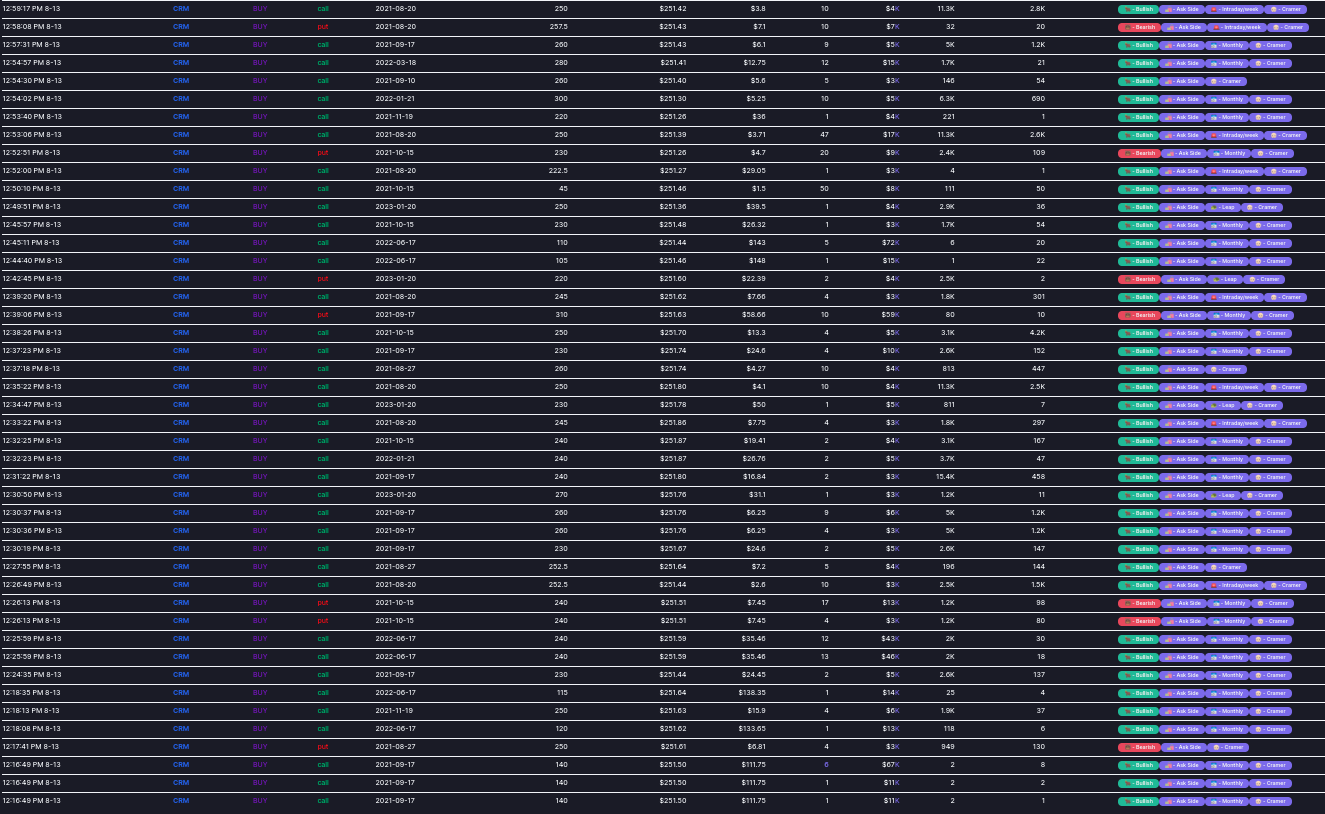
🌊 MCD: Flow reading
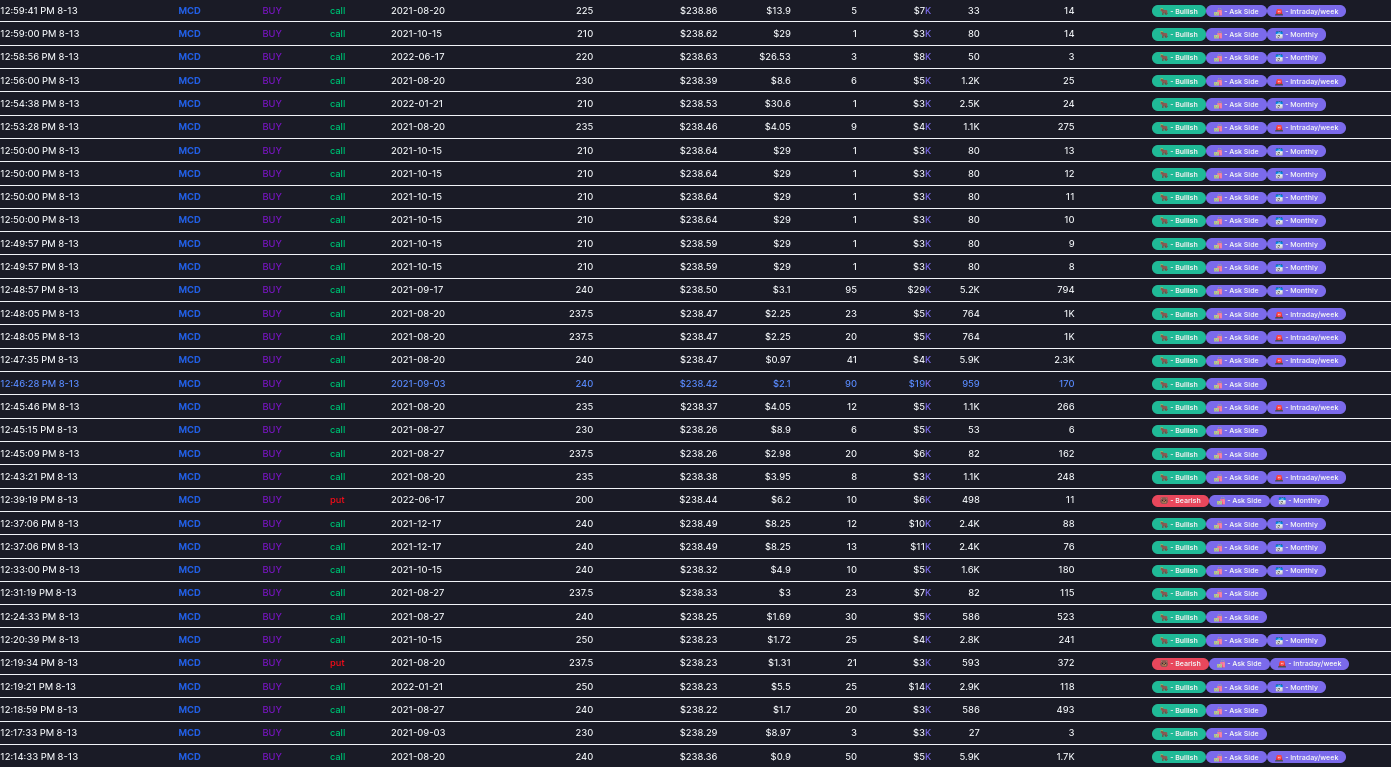
📈 MCD: Flow Chart ($2,500+ Premium, 93%🐂)

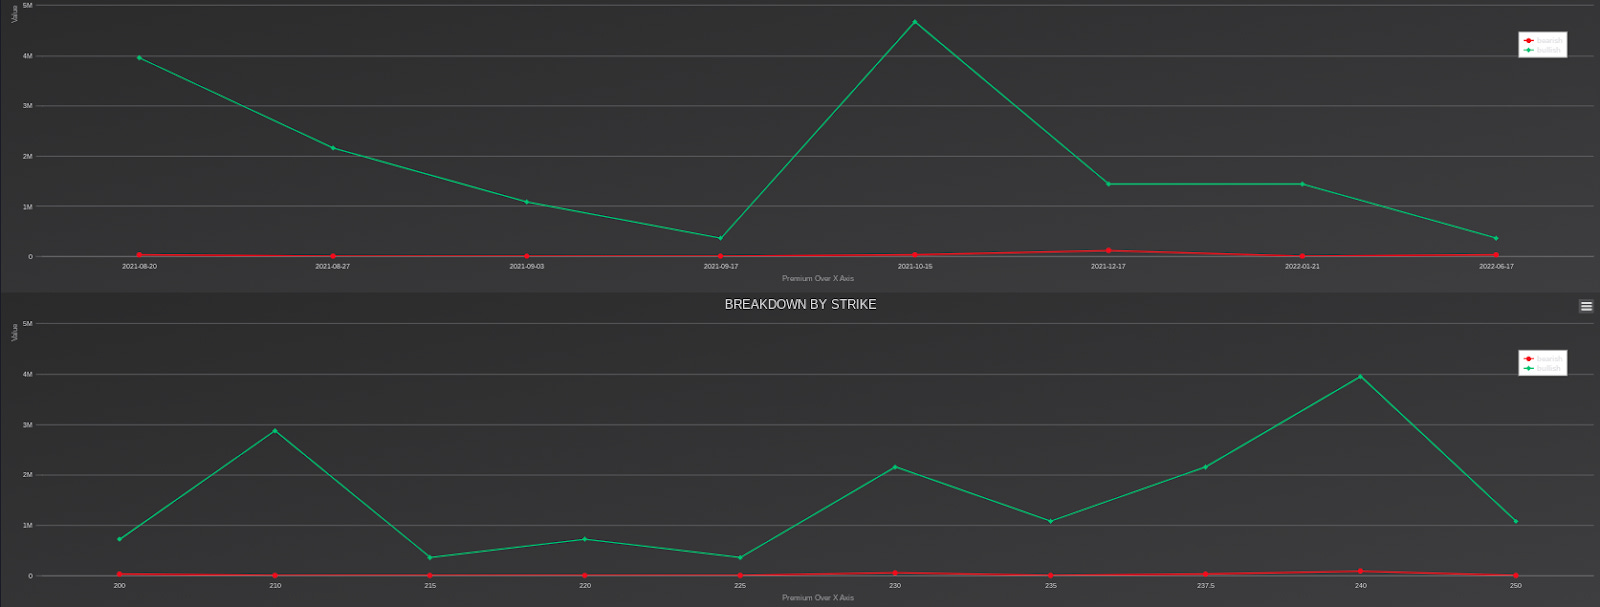
⌚️MCD: Expirations and Strike
A lot of attention on the 8/20 next week and the October monthly, with the 240 strike popping off.
📊 MCD: Chart (4 hour)
Holds the 150 EMA here on the 4 hour, potential cup and handle forming.
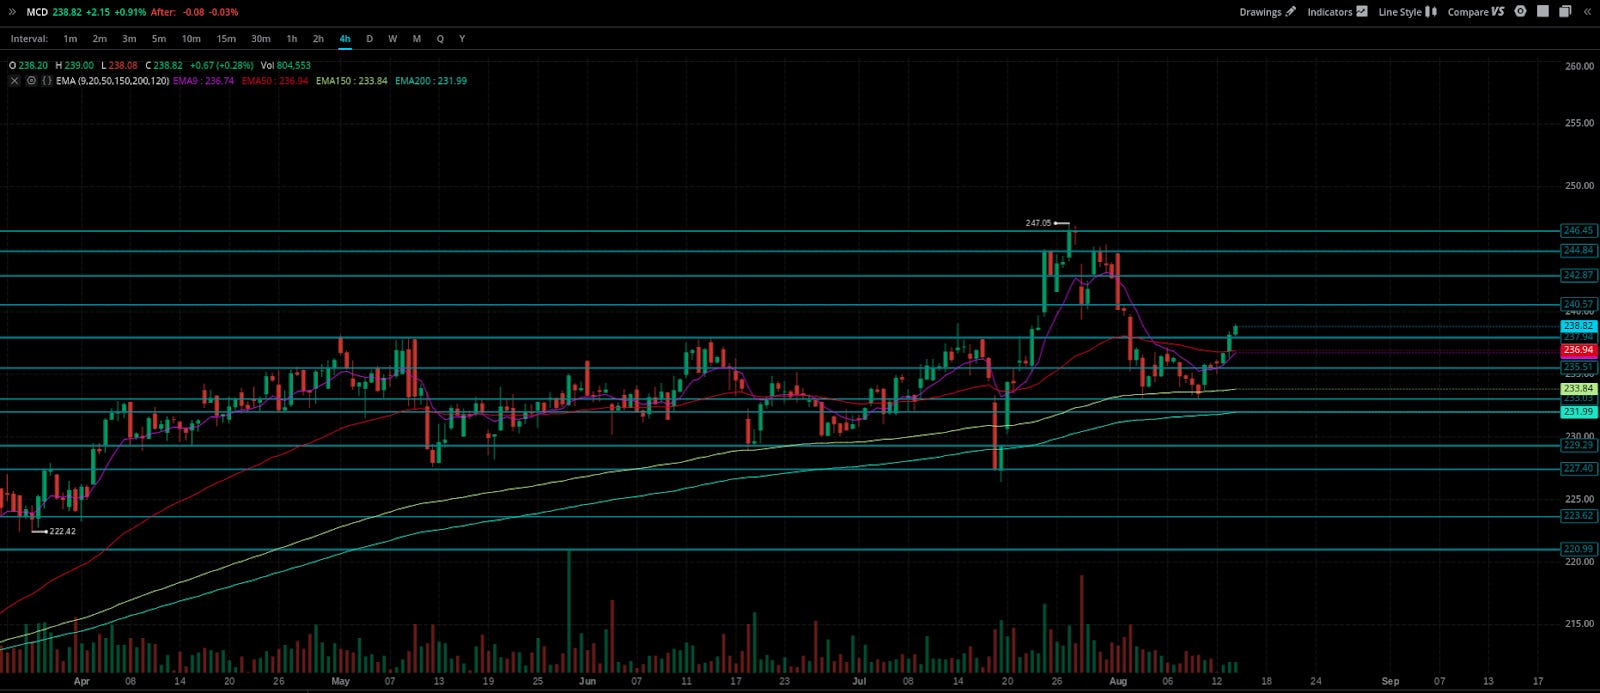
📝 MCD: Levels
Upside:
240.57, 242.87, 244.84, 246.45
Downside:
237.94, 235.5, 232, 229.3
2. CRM Calls
It feels so weird to say this high-flying tech company is a part of the DOW…but yes, it happened. It’s probably the most kickass company in the index, and has insane projections of 20% annual growth among some analysts.
🐳 CRM: Unusual Whales Alert
None Recently
🌊 CRM: Flow reading
📈 CRM: Flow Chart ($2,500k+ Premium, 83%🐂 )
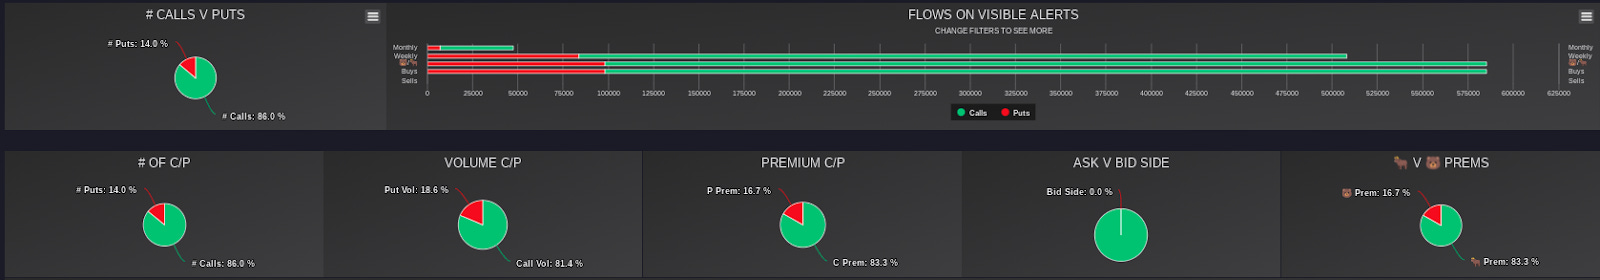
⌚️CRM: Expirations and Strike
Bigly spike on the 9/17 expiration, with premium spread between both OTM and ITM strikes.

📊 CRM: Chart (4 hr)
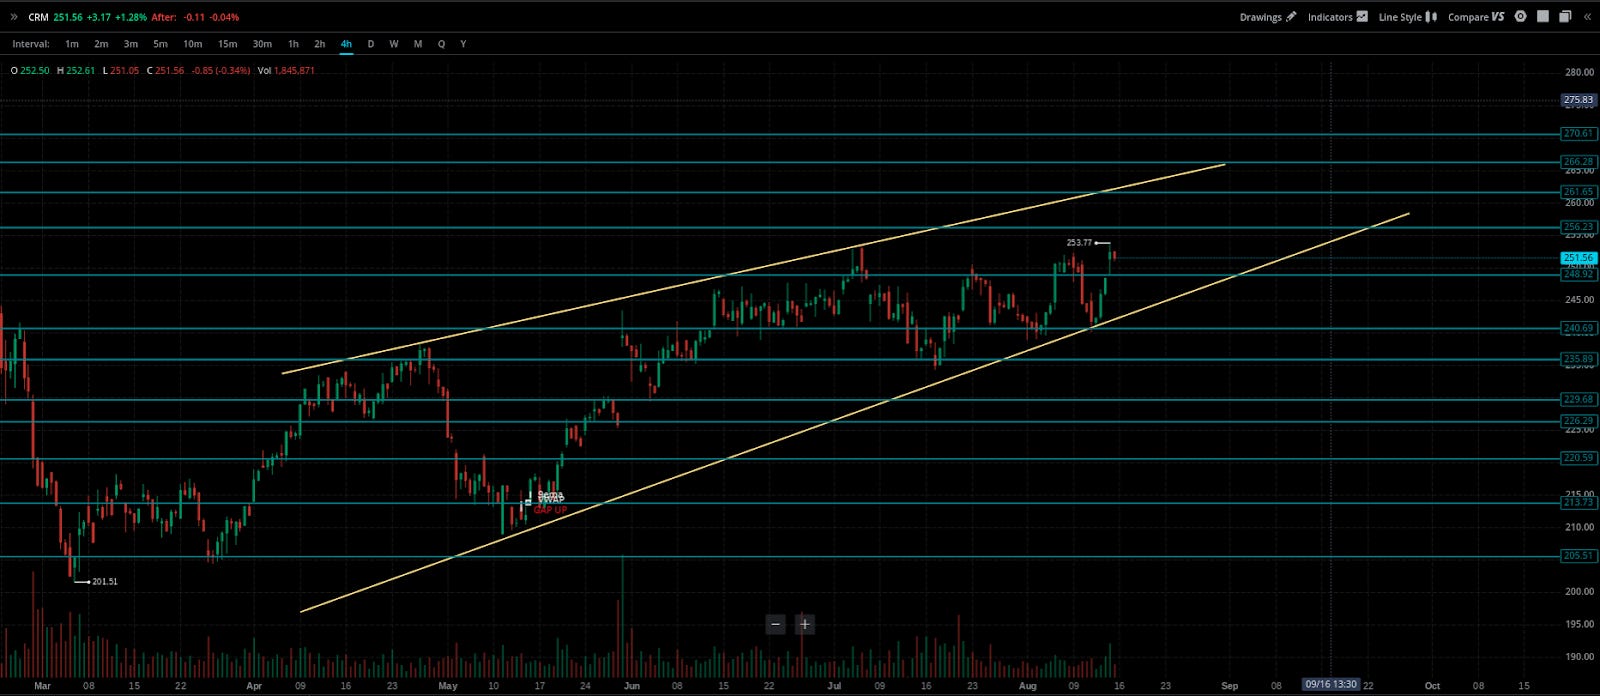
📝 CRM: Levels
Upside:
256.23, 261.65, 266.28, 270.6
Downside:
248.9, 240.7, 235.9, 229.7
3. WBA Calls
It’s ready. This was a source of much debate in the Discord, but I am confident in this play, but this play survived the slings and arrows of my brethren to stand proud with WBA. For the elderly, they have a great dividend! Great divergent flow Friday.
🐳 WBA: Unusual Whales Alert

🌊 WBA: Flow reading
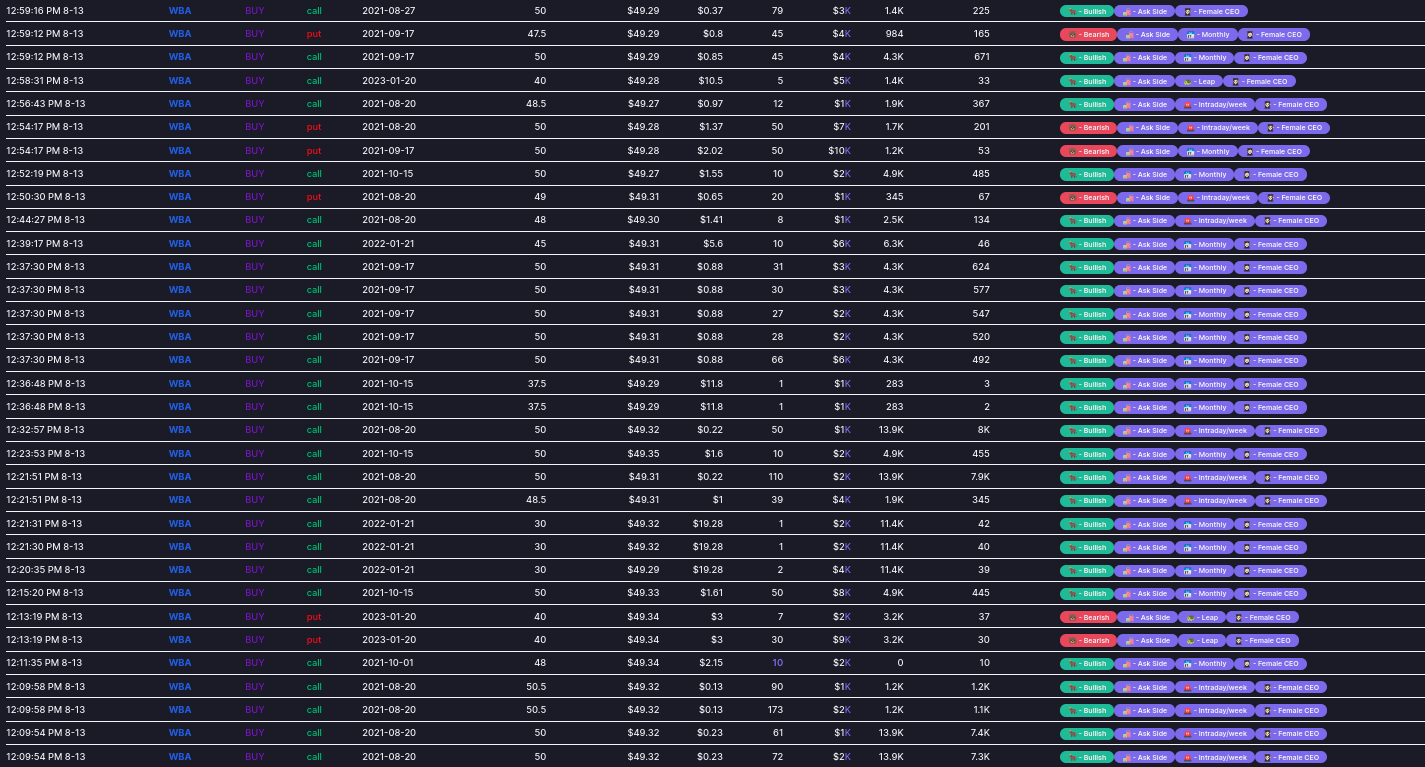
📈 WBA: Flow Chart ($1,000+ premium, 75%🐂)
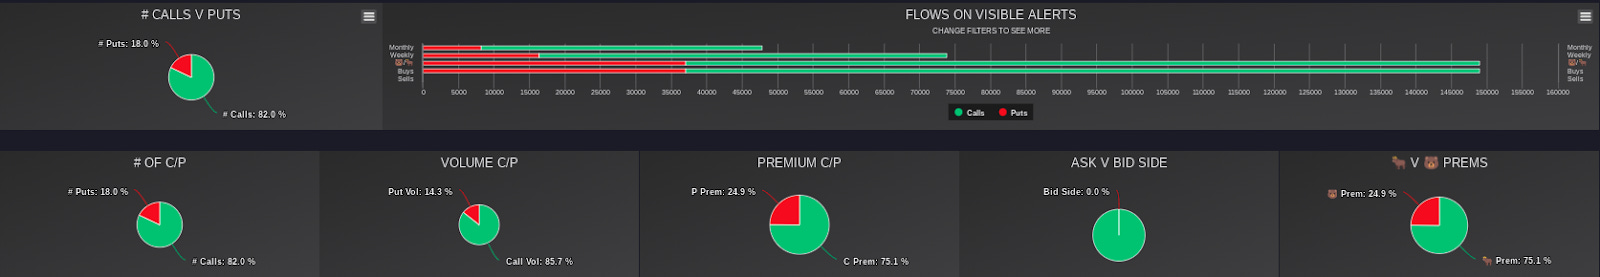
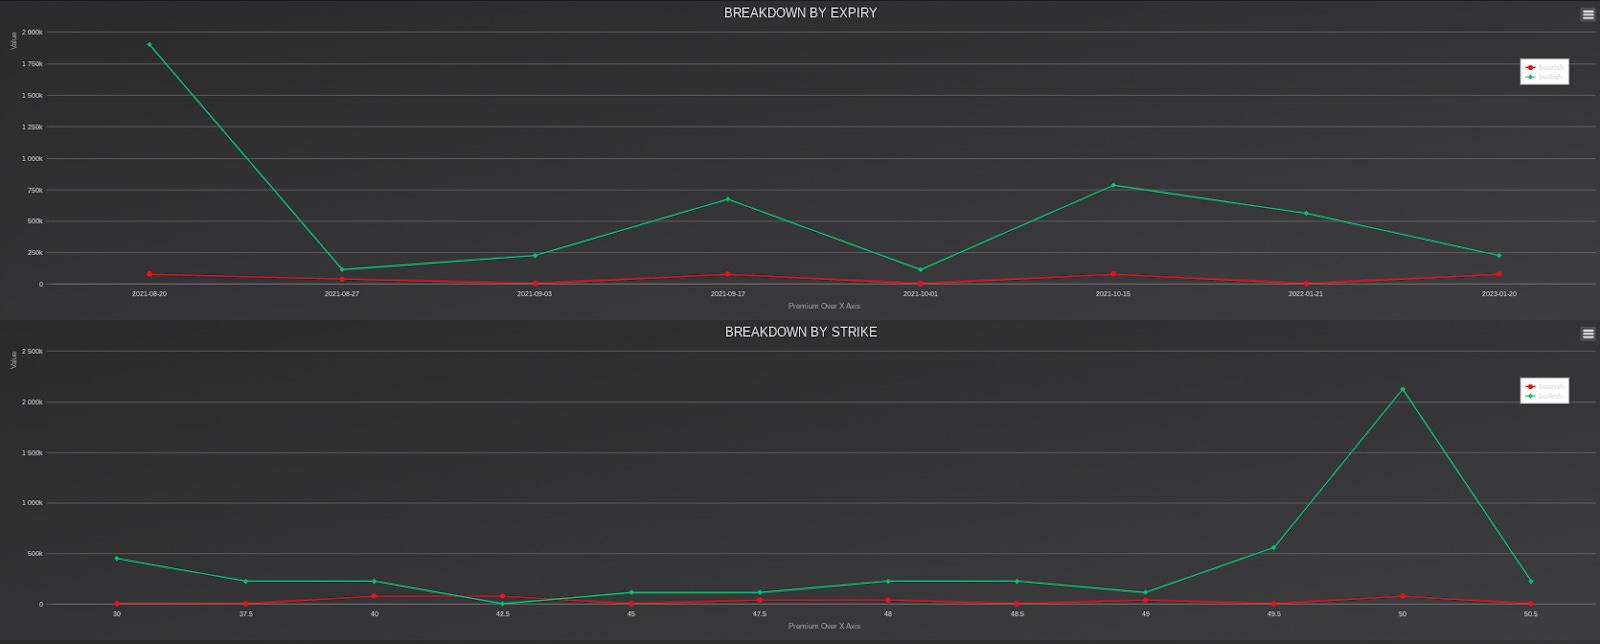
⌚️ WBA: Expirations and Strike
Big spike on the 8/20 expiration, attention on the 50 strike.
📊 WBA: Chart (4 hr)
Nice little cup and handle forming
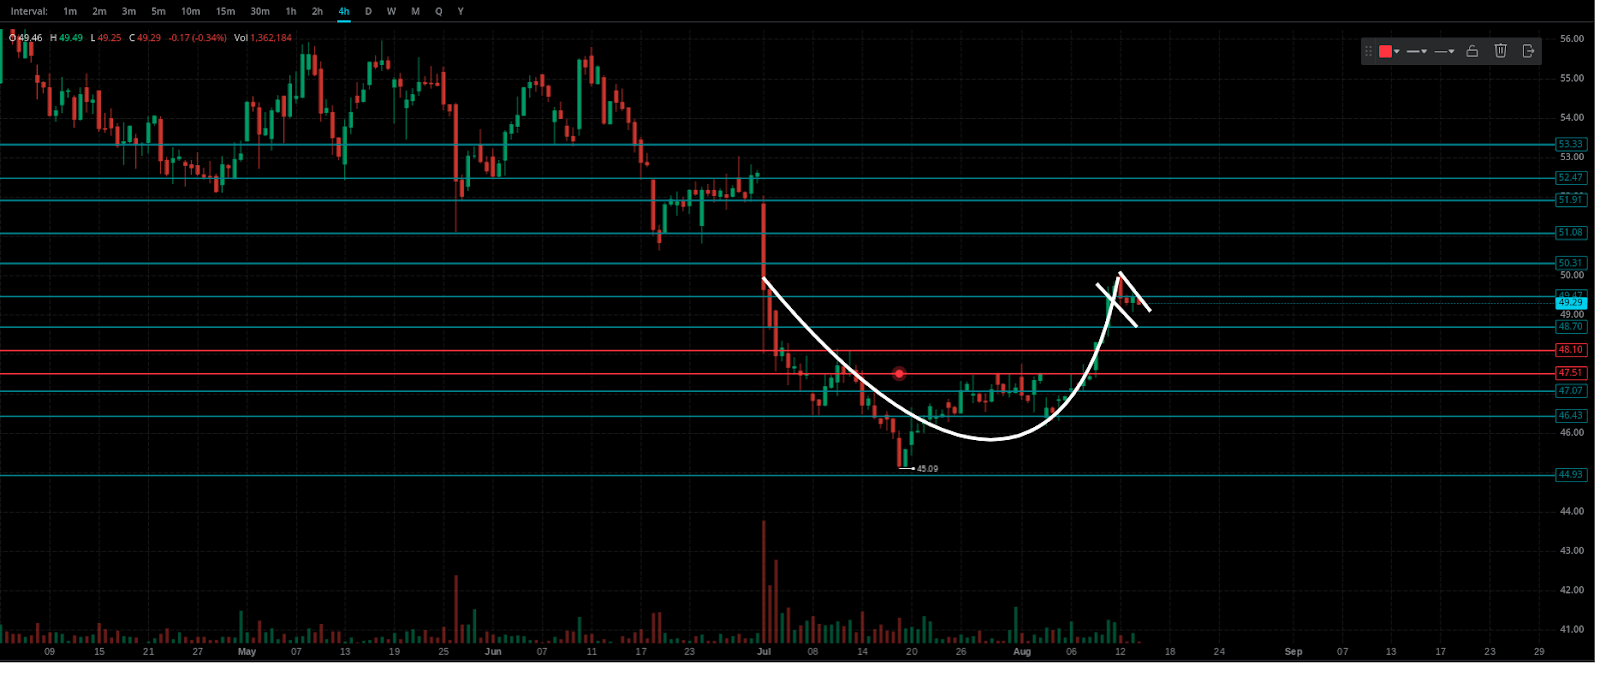
📝 WBA: Levels:
Upside:
50.3, 51.08, 51.9, 52.47, 53.33
Downside:
48.7, 48.1, 47.5, 47.07, 46.63
4. XLE Calls
That energy, though. Did a night read on them and saw they were ready—got it confirmed by my good friend EagleTorch. I’m sure @donmiam3 is reading this somewhere tickled pink lol.
🐳 XLE: Unusual Whales Alerts

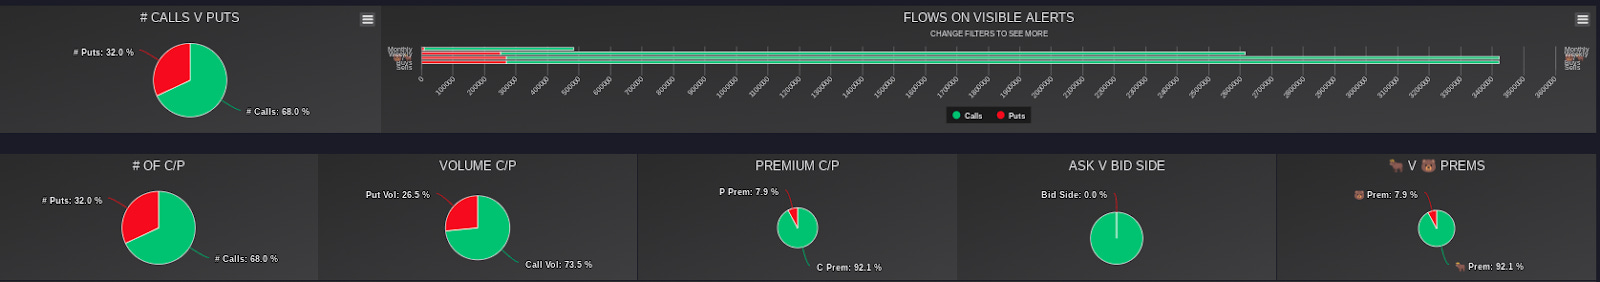
🌊 XLE: Flow reading
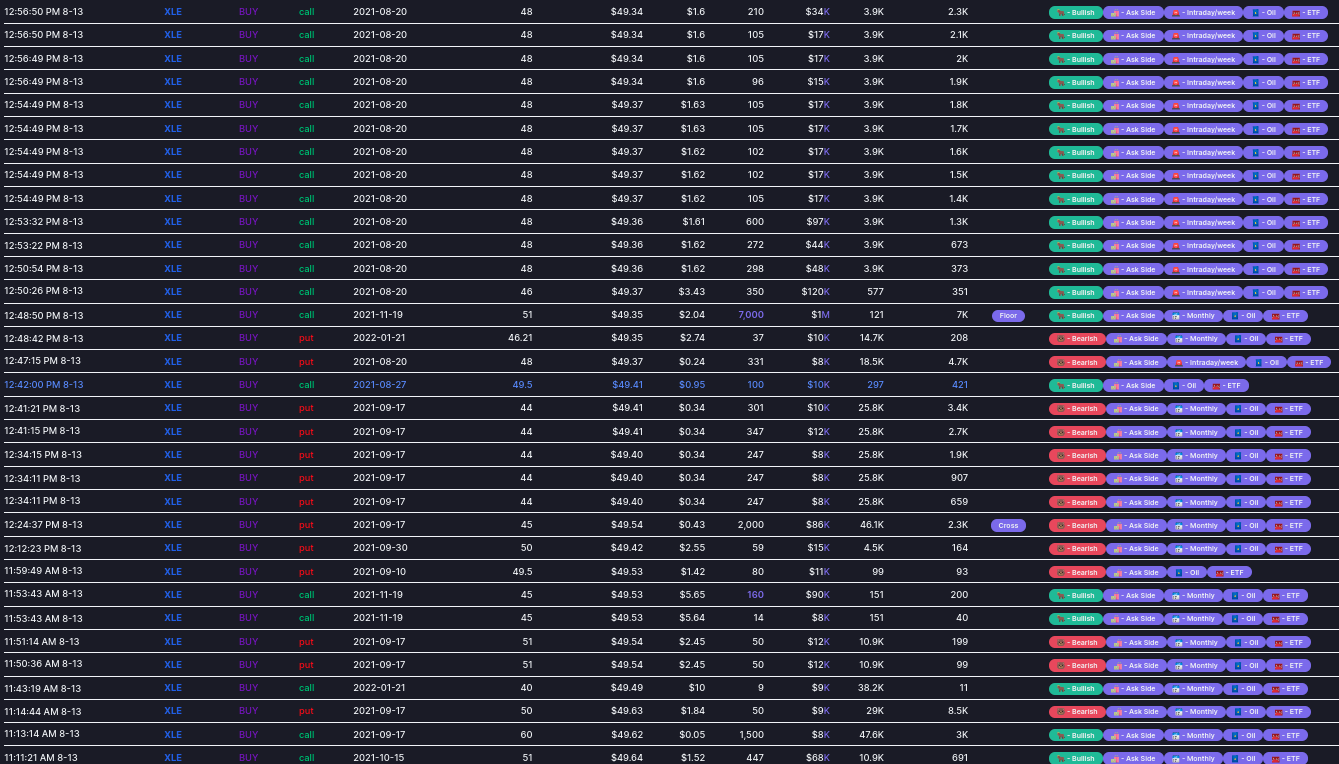
📈 XLE: Flow Chart ($7,500+ Premium, 98% 🐂 )
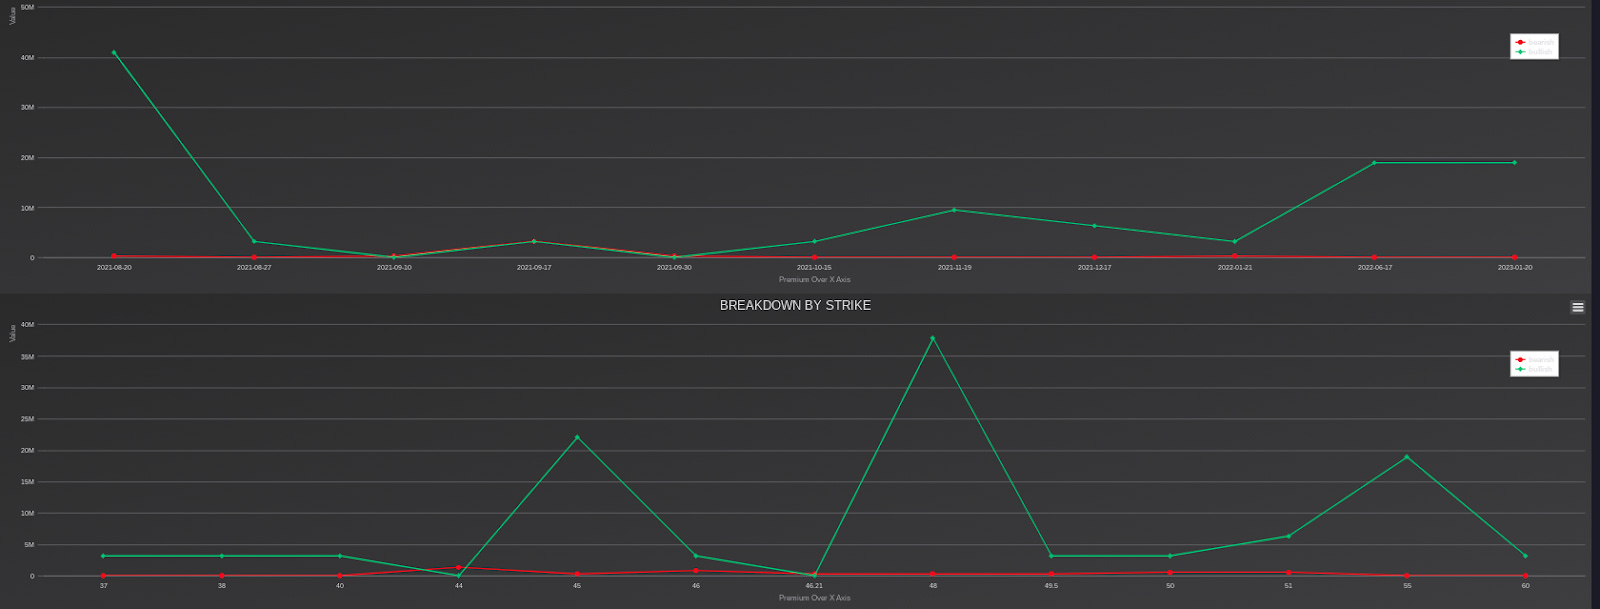
⌚️ XLE: Expirations and Strike
Big action on the 8/20 expiry, strikes 45, 48, and 55
📊 XLE: Chart (Daily)
Ascending triangle breakout

📝 XLE: Levels
Upside:
50.15, 51.37, 52.83, 54.75
Downside:
49.25, 48, 47, 46.25
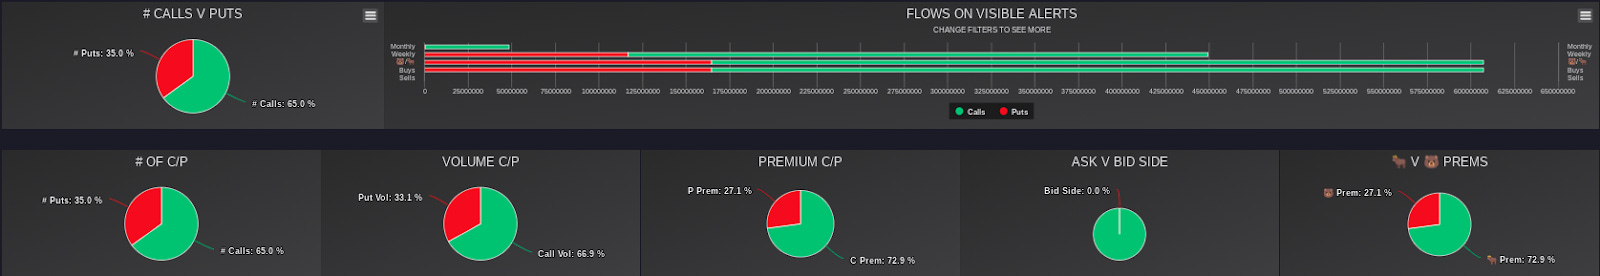
5. FB Calls
Zuck flow was looking really strong on Friday, and this is somewhat of a sleeper of ours right now (yeah right, a fucking Mega-cap as a sleeper lol). Yet, a lot of things are lining up for this old fav of mine. Watch OPEX pinning with a major player like this, and gamble responsibly.
🐳 FB: Unusual Whales Alerts
🌊 FB: Flow reading
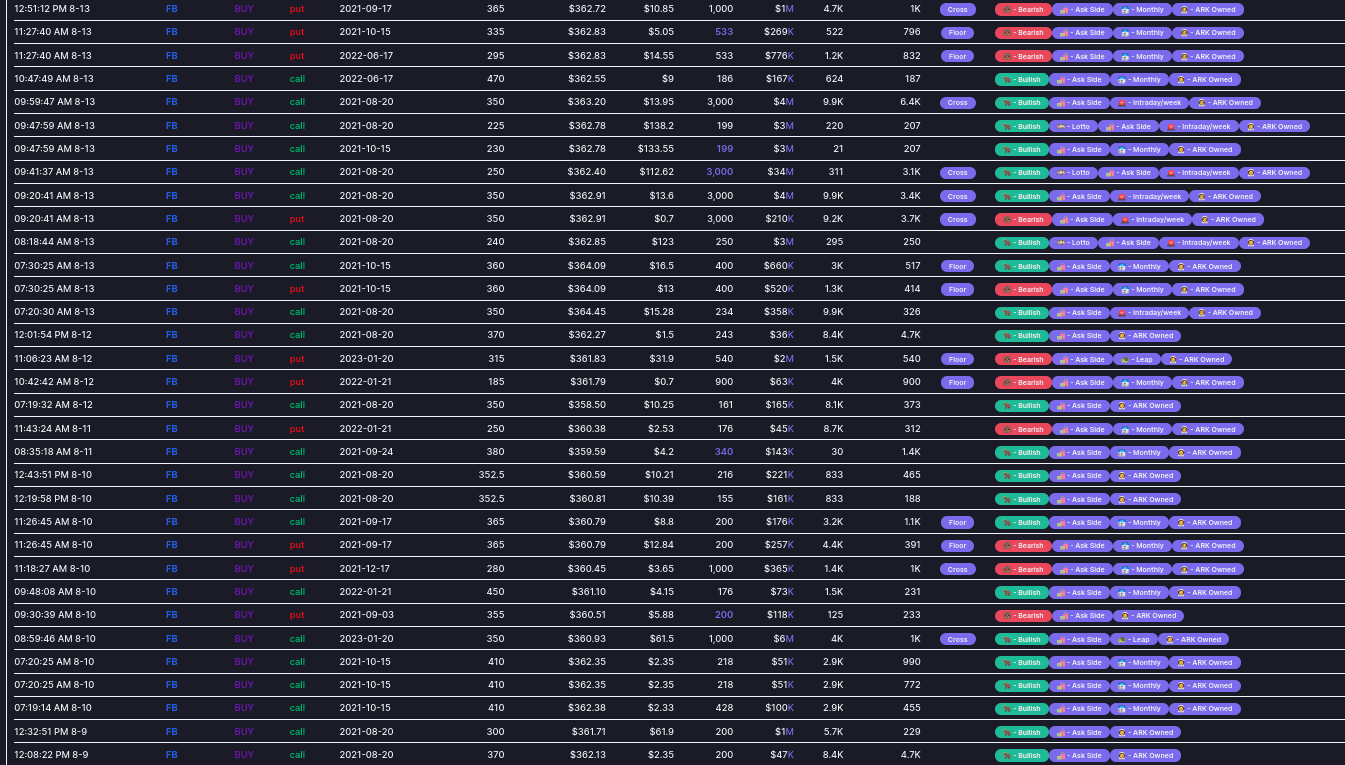
📈 FB: Flow Chart ($25,000+ Premium, 75% 🐂 )
⌚️FB: Expirations and Strike
Kind of all over the place but there was especially high interest in next week.

📊 FB: Chart (Daily)
Moving up in a channel, nice bounce at the 50 EMA I’d be wary if it breaks down.
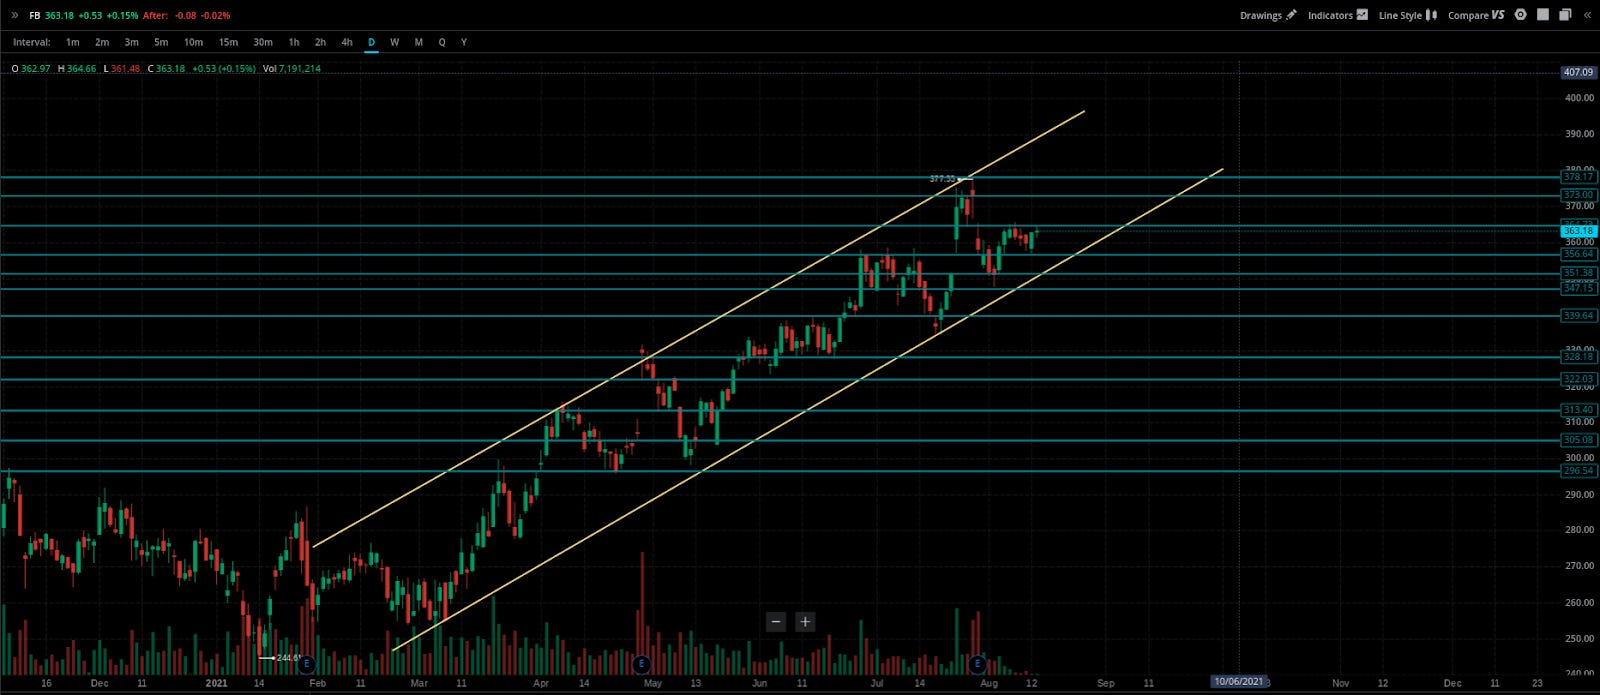
📝 FB: Levels
Upside:
364.75, 373, 378.17, ATH
Downside:
356.64, 351.4, 347.15, 339.64
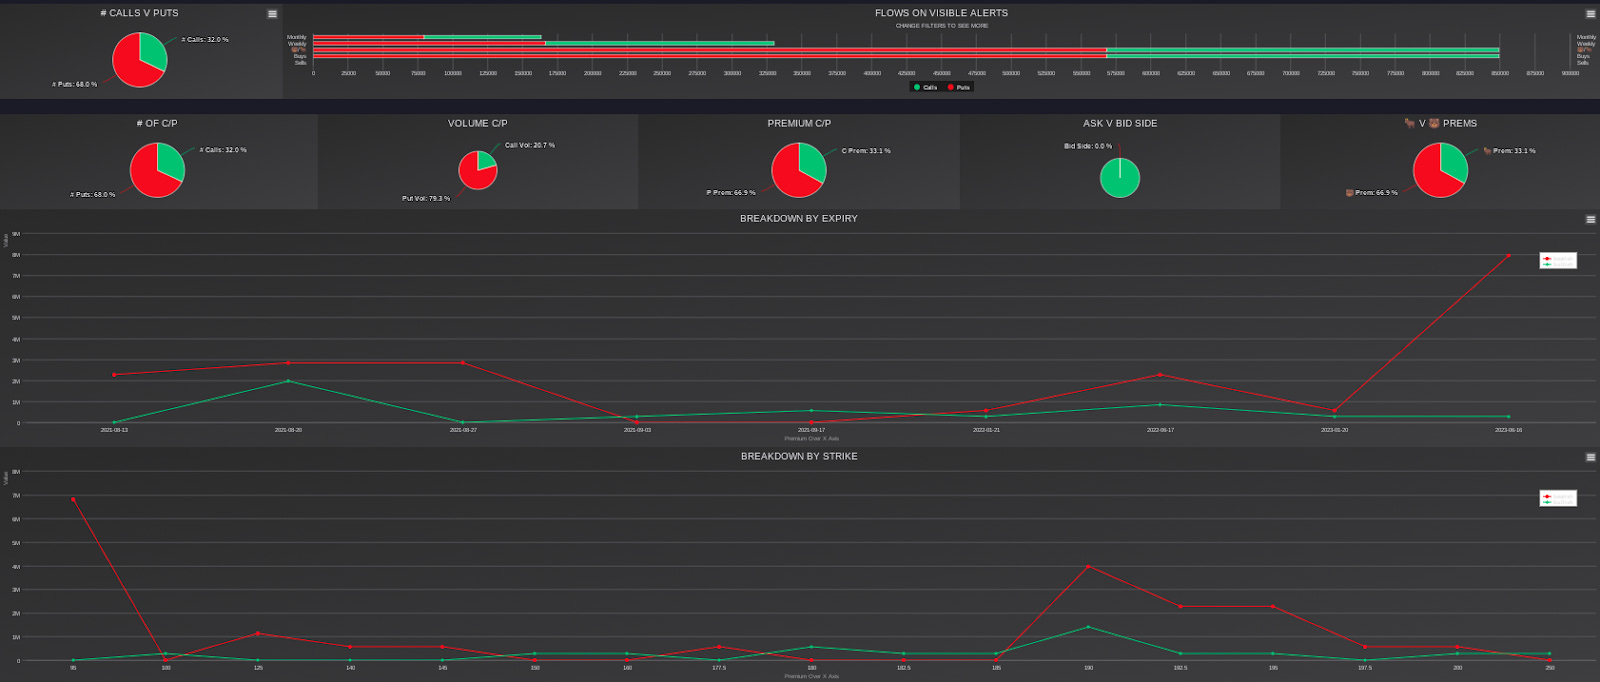
🎲 Earnings BONUS: LOW PUTS
Editor’s Note: This one was a little tough to say because it didn’t have a green day—but, neither did HD, which turned in much better flow comparatively. I’ll feel good about this if it runs on Monday and Tuesday. Anyway, it’s been a hell of a run—let’s fuckin’ ride 😎.
IF I played earnings, I’d say LOW had strangely red flow compared to HD on Friday, which is reporting just before LOW and is a competitor.
IF I played earnings, I’d say that expectations are incredibly high for this Wall Street favorite that has multiple buy ratings.
IF I played earnings, I’d say that the put/call ratio is as bearish as we usually see for close expirations.
If.
🐳 LOW: Unusual Whales Alert

🌊 LOW: Flow reading

📈 LOW: Flow Chart
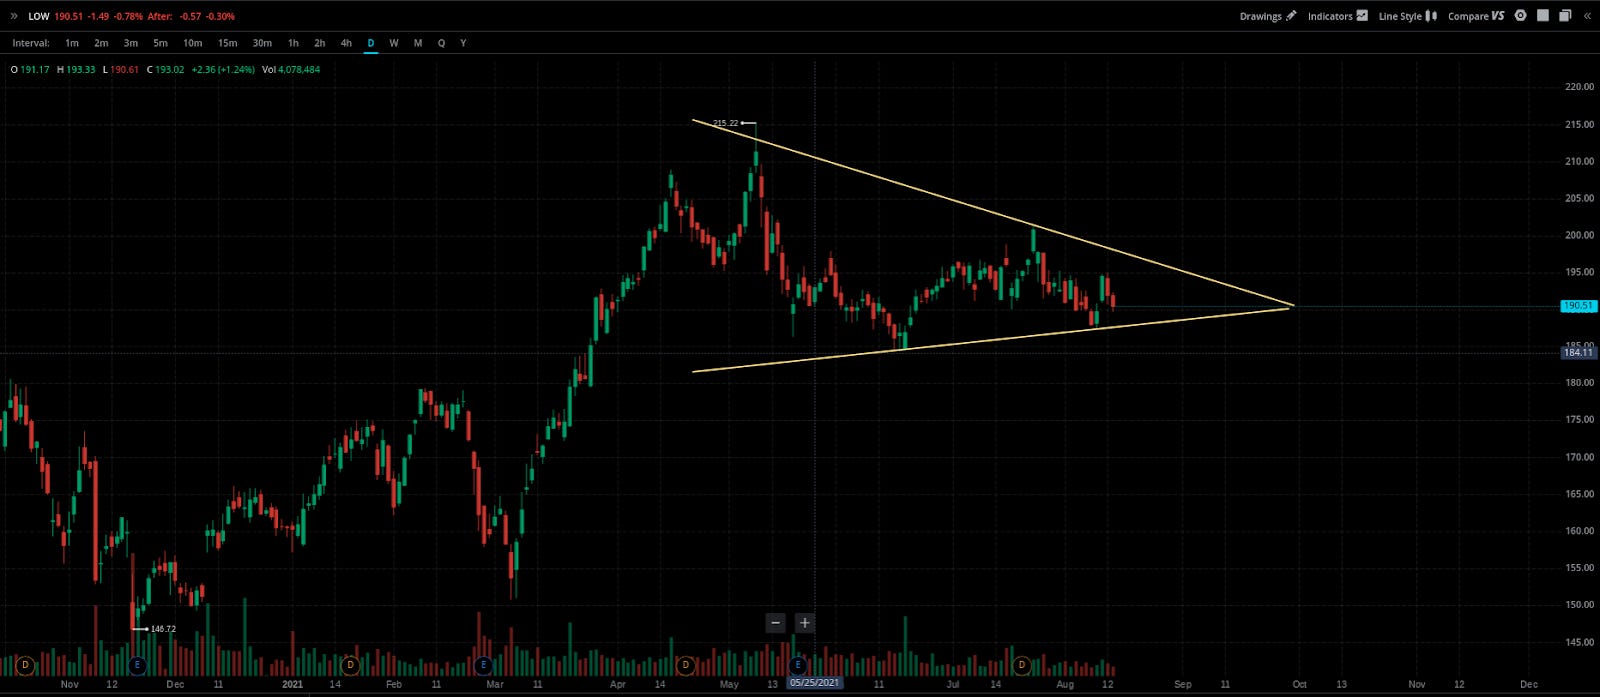
📊 LOW: Chart
Been stalled out for a while. That said, as I say each week, we don’t need no charts where we’re going.
Pt. 6: Weather: SPY & QQQ Forecast & Watchlist by @daarkmaagician 🌦
Below is the chart & info for a SPY & QQQ forecast from @daarkmaagician, his DISCORD (👈 click there) is the place to be (YEETers get two weeks free!). I’ve attached his accompanying text as an image with the photos below.
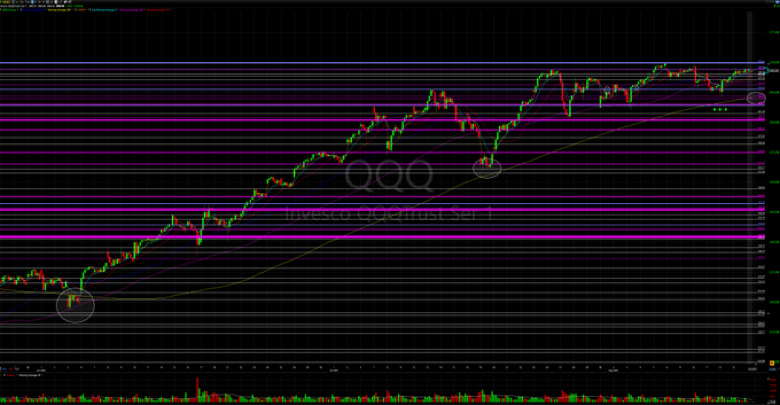
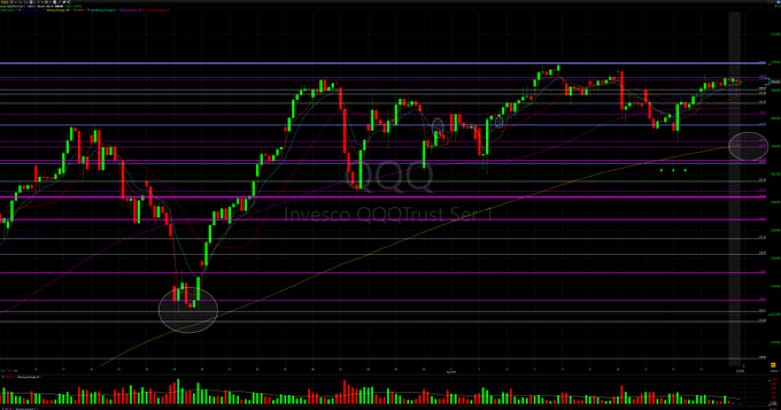
SPY/QQQ Charts Legend:
Solid Blue= ATH, Green= Dark Pool Buys, Red= Dark Pool Sells, Purple= Dark Pools, Orange= Supports/Resistances, Teal= 9ema
SPY Forecast:
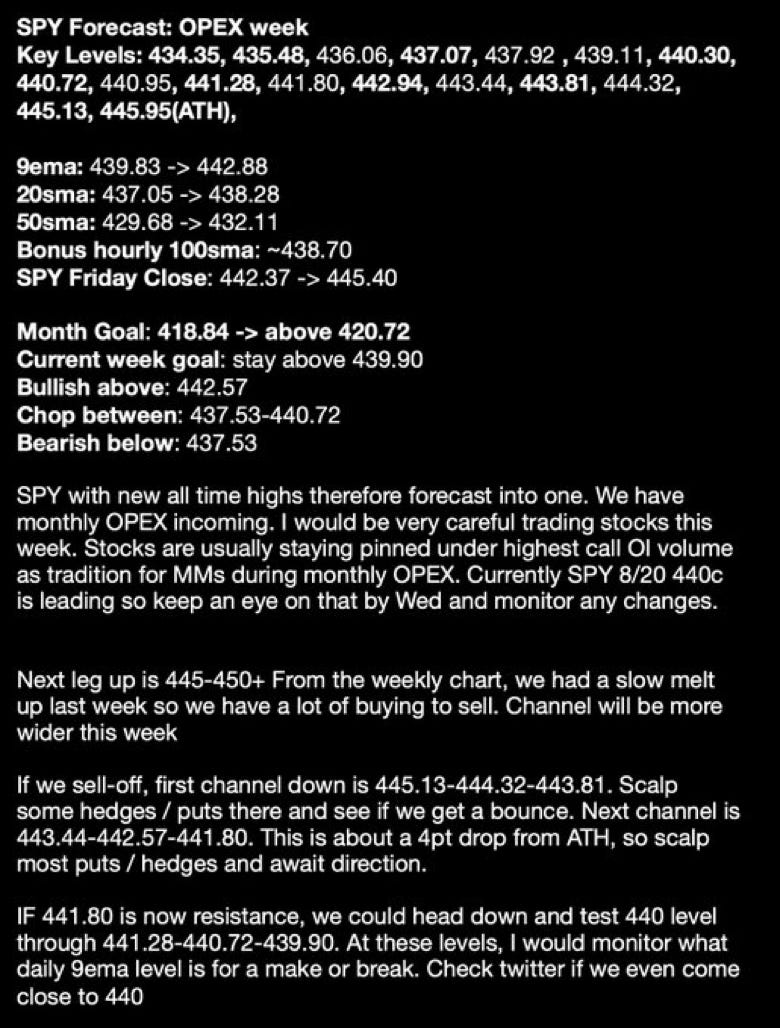
SPY Forecast Charts:
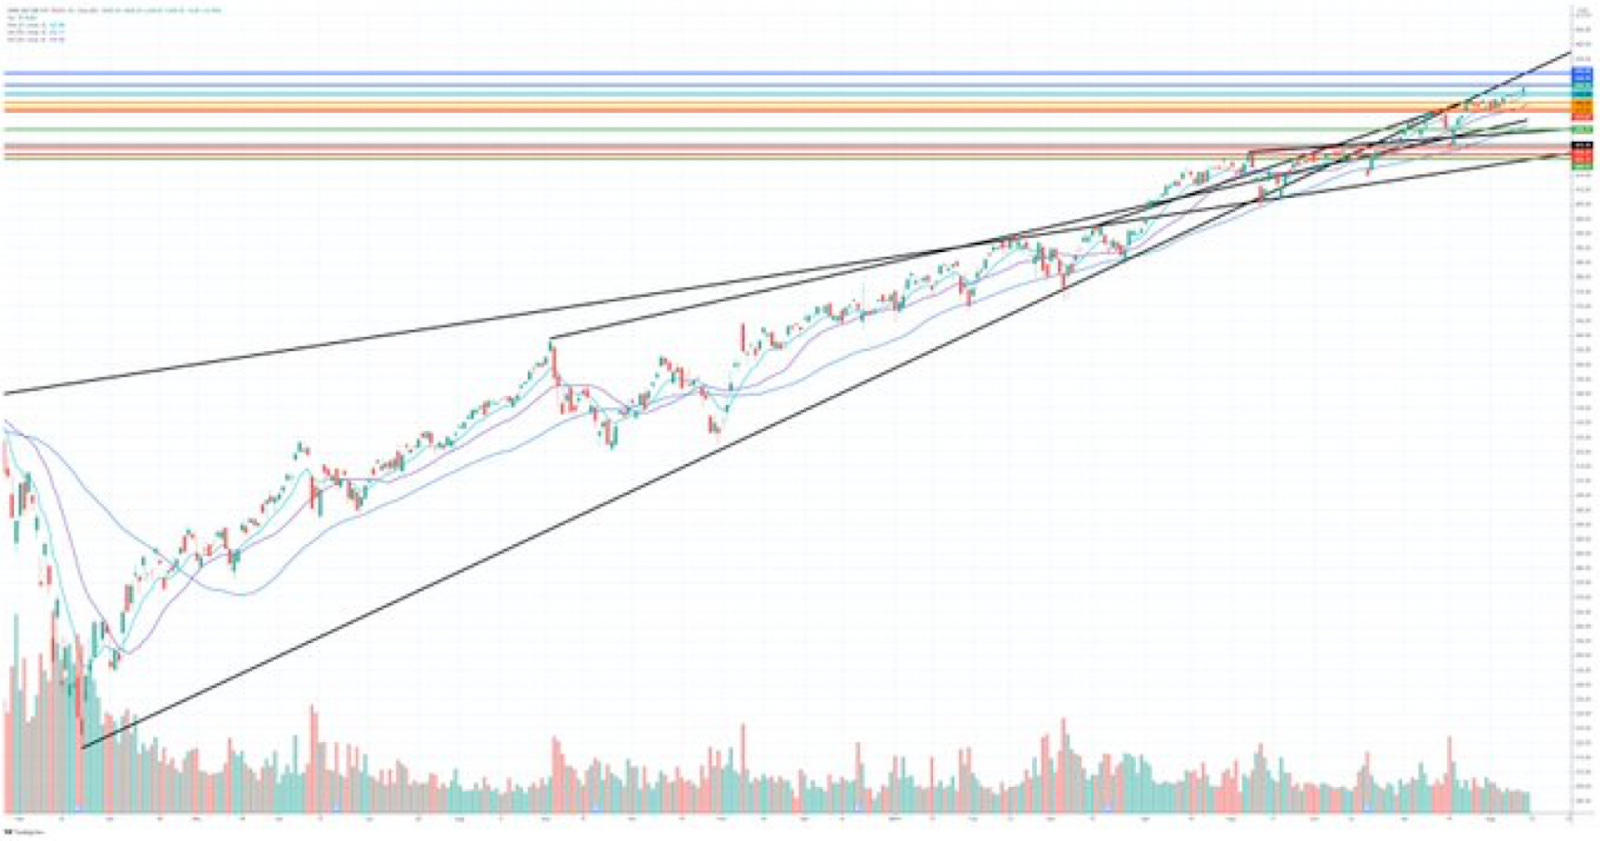
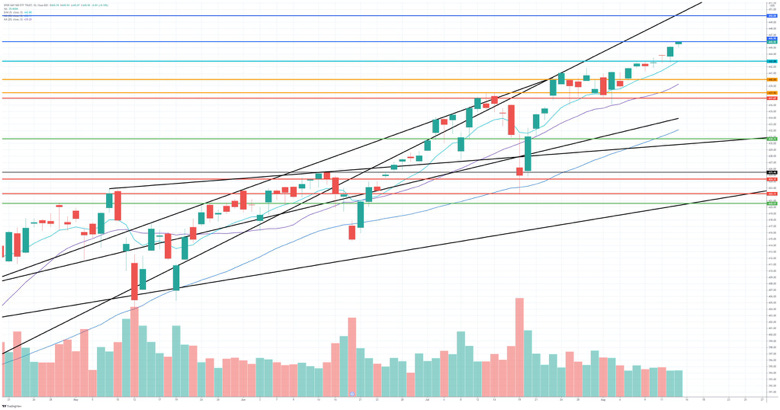
SPY HOURLY CHART
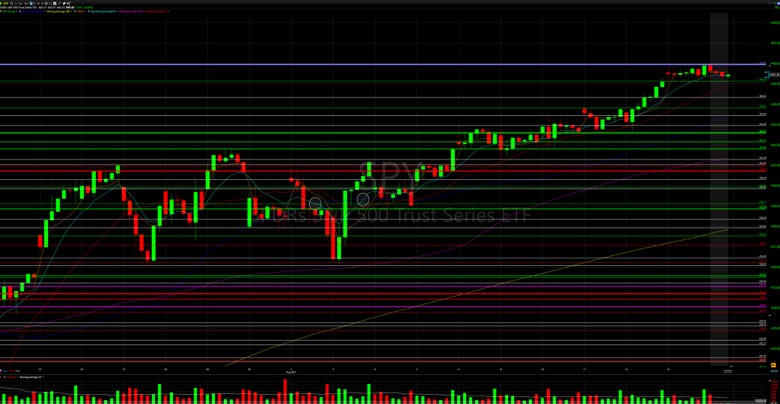
QQQ Forecast:
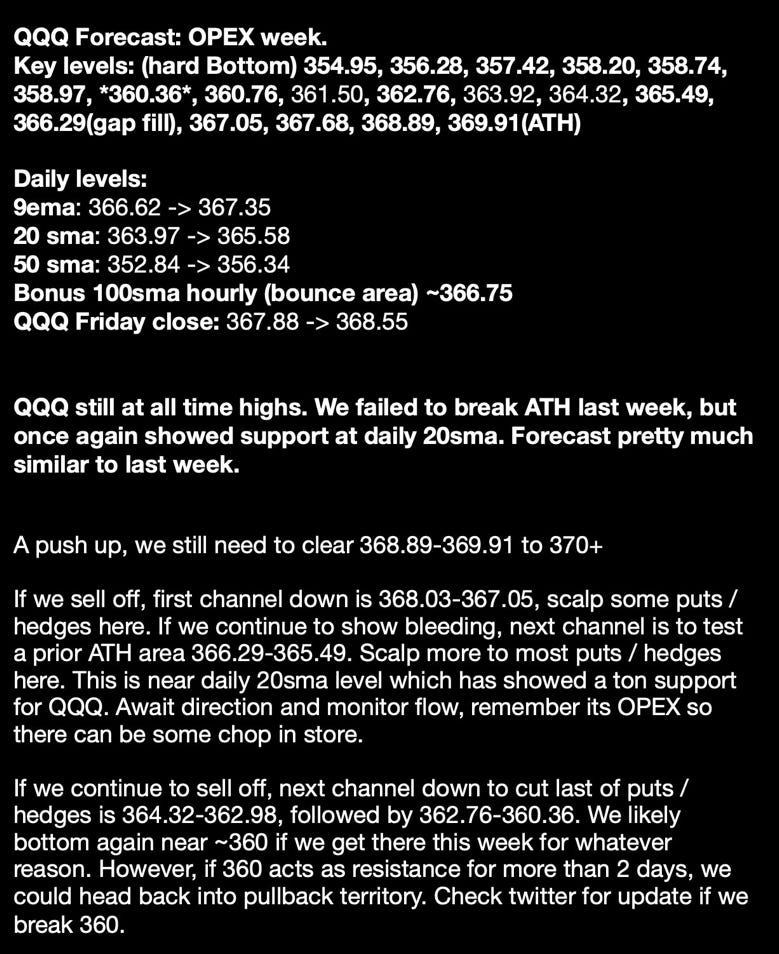
QQQ Forecast Charts:
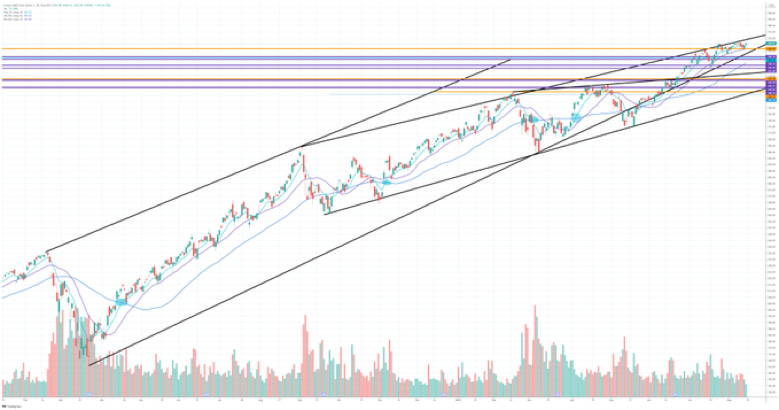
QQQ DAILY CHART

Make sure you follow @daarkmaagician to get updates on the indexes daily!
Pt. 7: TLDR & GOODBYE ✌️
TLDR:
Pt. 2: Cyptocurrency analysis
Pt. 3: B-A-T 7: Volume 101- using the Volume indicators on charts
Pt. 4: Hedge Funds
Pt. 5: 📞Calls: ⭐️MCD, CRM, WBA, XLE, FB — 👿Puts: None — 🎲 E.R. Gamble: LOW puts
Pt. 6: SPY and QQQ Forecast by @daarkmaagician
Goodbye and thanks for reading! Questions, scoops, comments @yourboymilt or /u/alldatdalton. See you next week! ✌