


🤔 Where Do We Go From Here?
Looking at QQQ and SPY historical momentum and volatility metrics to suss out the Price Action

🧠 What is PARI?
PARI (Price Action Risk Indicator) blends:
📈 Momentum – is price surging or stalling?
💥 Volatility – is risk shrinking or exploding?
📊 Trend Persistence – how consistent is the move?
It’s scaled between 0-100, where:
🔴 Low = High uncertainty, shaky trend
🟢 High = Strong conviction, clean price action
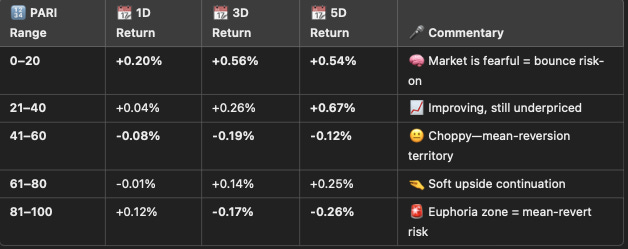
📉 QQQ PARI – Last 10 Days
Narrative:
QQQ’s PARI fell off a cliff early in the 10-day stretch, recovered sharply mid-week, then lost steam again by March 28.
🔎 Breakdown:
🧊 Mar 18-20: Danger zone (PARI < 20) = extreme uncertainty
⚡ Mar 24-25: Big bullish pop in momentum
🤷 Mar 28: Retreating again (likely a failed follow-through)
🔢 Visual:
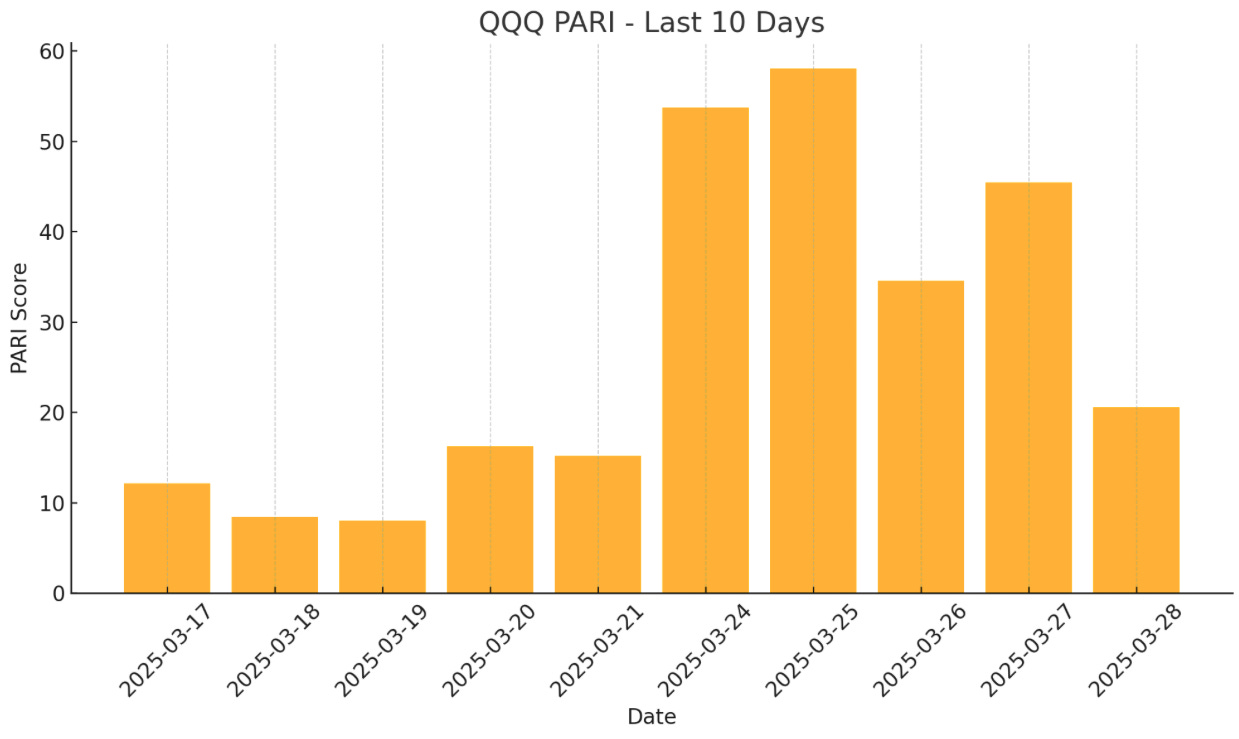
⚔️ QQQ vs SPY PARI – Battle of the Indices
🎯 What We See:
🔁 SPY = More stable PARI curve
🧨 QQQ = High variability, choppier signals
🟡 Both peaked Mar 25, showing shared market optimism
🧵 Interpret This:
🧠 SPY is acting like the adult in the room – controlled, dependable
🎢 QQQ is moodier – more susceptible to reversals and emotional price swings
🧪 If you're trading tech, use tighter risk and watch PARI slope changes
🔢 Visual:
🧮 Simple Model: Can We Predict 3-Day Direction?
We built a logistic regression model — dead simple, interpretable, and surprisingly effective at catching short-term moves.
🛠 Features Used:
📈 PARI — current score
🔁 ΔPARI — change from previous day
💥 Volatility — recent risk backdrop
🚀 Momentum — how fast price is moving
✅ Model Stats:
Accuracy:
65.3%Target: Whether QQQ is up 3 days later
📌 Today’s Prediction:
📅 Latest PARI setup →
55.0%chance of upside in 3 daysThis means the model is leaning slightly bullish, but it’s a low-conviction edge.