

YEET no. 12: 1776
YEET no. 12: 1776
Welcome to The Yeet, a weekly DD where we try to tilt the casino...

Hey! I’m @yourboymilt, and welcome to retail’s Sunday Paper.
I should probably let you know...This is not financial advice! We are here to entertain while giving you ideas, perspective, and angles. Do your own research, I prithee. And if you aren’t subscribed, join us here:
Creator/Editor:@YourBoyMilt The Architect: 🧠 Publishing Associate: @rclarkspear
Pt. 1: Week’s Thoughts, Pt. 2: Space Balls, Pt. 3: Build-A-Trader no. 3 (B.A.T. 3): EMA in yo T.A., Pt. 4: Look Who’s Talking (@mkt_sentiment), Pt. 5: Watchlist, Pt. 6: Index Forecasts (@daarkmaagician ) Pt. 7: TLDR
Sector article of the week: Space Exploration, recommended by @l0n3w014
🇺🇸 Pt. 1: 1776
The Great Bull Run is limping along, though it’s fizzled to a sparkler from an M-80.
We’ve now officially gambled away the first half of 2021, with Q2 entering the books this past week. In reflecting on where we’ve gone in the first half of this year, I feel a natural desire to draw a comparison to the same time last summer. It seems that the endless, starbound bursts of green accounts in the sky have reached a finale, now embers drifting back toward a market of normalcy. The settling smoke has obfuscated the view “to the mooooon”, and speculative direction is more and more difficult to see through the haze. Well, at least it was for your boy on Friday:

This week was another quiet one, a slow stroll down the streets of Pleasantville as the indexes slowly crept upward, flip-flopping along the way. On Monday we had Grandaddy DOW seemingly down for the count, struggling to keep up with the Great Tech Revival (DOW Jones? More like DOWN Jones, AMIRITE guys?!). Yeah, anyway, that changed frustratingly in a slow back and forth all week with boomer stocks falling, tech stocks rising, and a predictably unpredictable futures switcheroo into the next choppy session. The DOW ended red, tech ended green, and SPY moved along slower than a white man in slippers. The week was, appropriately, representative of the first half of the year; a predictably slow, mildly bullish climb upward with nonthreatening bumps in the road.

On a week this blah, with a milestone this important, I guess it makes the most sense to focus on what that milestone means. What has the first half of the trading year truly been about? Surely, inflation talk and reopening have been the recent rage, but I’d argue this year so far was dominated by coverage of The Stonks Heard Round the World. GME and the like meant so much not because of the money made or lost, but because they represented the most American value their is:
Freedom.

Financial freedom, at least. It’s a common phrase we all hold dear, yet it rings true differently for all of us. For me, it would mean owning a great home while living in one of the most expensive fucking cities known to man, Los Angeles (apologies to SF and NYC). For you it may mean a car you can be proud of, having your student loans paid down, or being able to take your family on that dream vacation. For the modern FURU, it may mean flashy new purchases to “motivate” followers 🙄, or a better computer with better photoshop to create better gains 🤭.
Early 2021 became the year of potential independence for so many, the inciting incident being those Stonks Heard Round the World. GME, AMC, and the others became more than just investment opportunities, and quickly represented the swelling cry of the proletariat. The greatest movements are borne of a desperate hunger for access and dignity— I think it’s no coincidence that the popularity of the options market soared while economic conditions had plummeted. Stimulus checks and unemployment have been piled into Robin Hood, TDA, and even high-yield savings accounts. To this day, major banks saw an increase in their investment profitability that should make us the toast of the town.
Profit at JPMorgan’s investment bank surged 43% last year as it kicked off Wall Street earnings season in a year shaped by the Covid-19 pandemic.
Revenues in the investment bank rose to record levels. Profits in that unit reached $17bn.
Handing profits to those investment banks while simultaneously being barred from trading our own stocks freely with those investment banks feels a bit like oh, I don’t know, maybe taxation without representation.

So you and I are living history my friend, soldiers of a burgeoning financial revolution. As revolutionaries our current pathway is both new and old, simultaneously novel and obvious. See, the options market has been bastardized for decades; it was initially an instrument of insurance for deeper pockets that has been raided by us, those damned speculating rebels. Now options are a loophole for the enterprising, a rip in the fabric of the flag of the wealthy that allows us to see through to the other side. If we’re smart, hard-working, or just fucking lucky, we can tug at that rip until it’s a tear. Then pull at that tear until it’s a hole. And then, perhaps, we can finally climb through to the other side of wealth. And what’s more American than being given—no, taking—a speculative opportunity that gives us a hope for something more? You’d think that the nation’s financial infrastructure would applaud us rather than denigrate us. But, as they say, freedom isn’t free.
Who do we turn to in the fight for our freedom? Who will help us toss our tea in the Boston Harbor? Who can we count on when we’re surrounded by market makers, institutions, and deep pocketed investors who use the full arsenal of weapons against us? How do we fight when they can fire market manipulation, absurd bid/ask spreads, and the full weight of financial media to scatter our resolve like artillery bursts over the bluffs of Bunker Hill?
How do we win when the turncoats selling out our revolutionary interests (order flow) are the same ones who provide our alleged home and vehicle for refuge (cough, Robinhood, cough)?

I choose to believe in the power of our community and the leadership that brings us together into a cohesive mental power; we retail traders have been an initially sloppy yet increasingly synchronized row of bidding bayonets. I’m proud of you. I’ve been amazed at the tools of leaders like @unusualwhales, the villains who’ve turned into honest and cunning heroes like Portnoy, those lighting a path to gallop unscathed through the chaos and confusion of the battlefield like @deepfuckingvalue.

And, it’s my hope that in the second half of the year Your Early Entry Team will somehow be considered a part of that, and play a role in your inevitable, personal, and hard fought victory in the battle for financial freedom.
Some days financial freedom feels far and some days it feels close. Today, after having watched the symbolic brilliance of fireworks light up the sky last night, speaking out against the powers that be feels dramatic, necessary, important.
It feels like the burst of muskets in the moonlight, and the approach of lanterns in the mist.
It’s the battle for the freedom we deserve.
It’s 1776.
Welcome to YEET no. 12, brought to you by Paul REEEEEEEEEEEEvere’s ride.
🚀Pt. 2: Spaceballs
This week’s sector article recommendation by: @l0n3w014
Investing in the great beyond can bring your account to new heights or send it crashing to Earth.
“To the moooooon” is no longer a figurative statement.

Space flights are ramping up and so is the acrimonious race between Richard Branson’s Virgin Galactic (SPCE) and Jeff Bezos’ Blue Origin. Branson is a true genius, but also a true asshole: Bezos had planned a test flight with himself onboard for July 20th, the 52nd anniversary of the Apollo 11 moon landing. Well, guess what? On Thursday night Branson announced he’d beat Bezos to the punch by nine days, swiftly getting his septuagenarian ass onto a test flight the 11th. Oh, the disrespeck!

How much would you pay to do something—anything—for ten minutes? Well, apparently commercial travelers pre-ordering their seats on Branson’s VSS Unity are paying $250,000 for the ten minute ride. Personally, $250,000 for anything that takes about as long as it does to drop a deuce is too much for my taste. But, then again, that’s mostly due to the fact that I can barely afford to buy an AMZN call as it is; a weekly AMZN call.

While the world watches these two rich dudes race each other in an intensely phallic competition, another super rich dude is tackling space in a different way. Elon Musk’s Starlink, a project of SpaceX, is on an ambitious mission to provide internet to the world via satellite—especially those that don’t have access in remote locations. Though he’s not dominating the news cycle like Bezos and Branson (when it comes to recent space exploration, anyway), right now the pure excitement of what Musk is doing is enough to consider him the space race titan; he’s even got terrain exploring robotic dogs and a coveted partnership with NASA. How’s he doing this? Lots of big-ass rockets dropping off big-ass satellites.
Starlink is still in its beta phase, though Musk noted back in May that the service had already received over 500,000 preorders. Amidst this demand, SpaceX has been ramping its Starlink launches, with the private space company putting about 1,800 Starlink satellites to orbit as of date. SpaceX may be looking to launch larger batches of Starlink satellites in the future as well using Starship, a vehicle with a much higher payload capacity than the Falcon 9.

Before you get a rocket-sized rager at the prospect of investing in “The Tesla of Space”, it’s important to note that Elon himself recently said that Starlink isn’t going public for a few years. Luckily there’s some other ways to play the sector, including boomer companies you may have not realized are in the game, as well as some newer companies with plenty of upside. Sure, you could invest in AMZN or SPCE but let’s be real; nobody wants to take out a second mortgage to buy AMZN calls spreads, and SPCE is near the top, volatile, and potentially a huge “sell the news” event post-launch.
The key with any of these companies? Payload delivery. The reason they’re producing rockets with the swiftness is to drop satellites, terrain exploration vehicles, and anything else you may have seen in “The Martian”. Now that the mass-adoption of rocket use is on the table, new applications are coming into play as well: the U.S. Space Force, for example, wants to deliver cargo around the world with their rockets.
Called Rocket Cargo, they experimental military program will be led by the U.S. Space Force, the Pentagon said. The program will research and help develop capabilities such as landing “a rocket on a wide range of non-traditional materials and surfaces,” engineering “a rocket cargo bay and logistics for rapid loading and unloading”
And, of course, The Space Force mentions Starlink/SpaceX as the company they want to work with. Well, since you can’t invest in Elon’s baby yet, let’s take a look at some other key players:
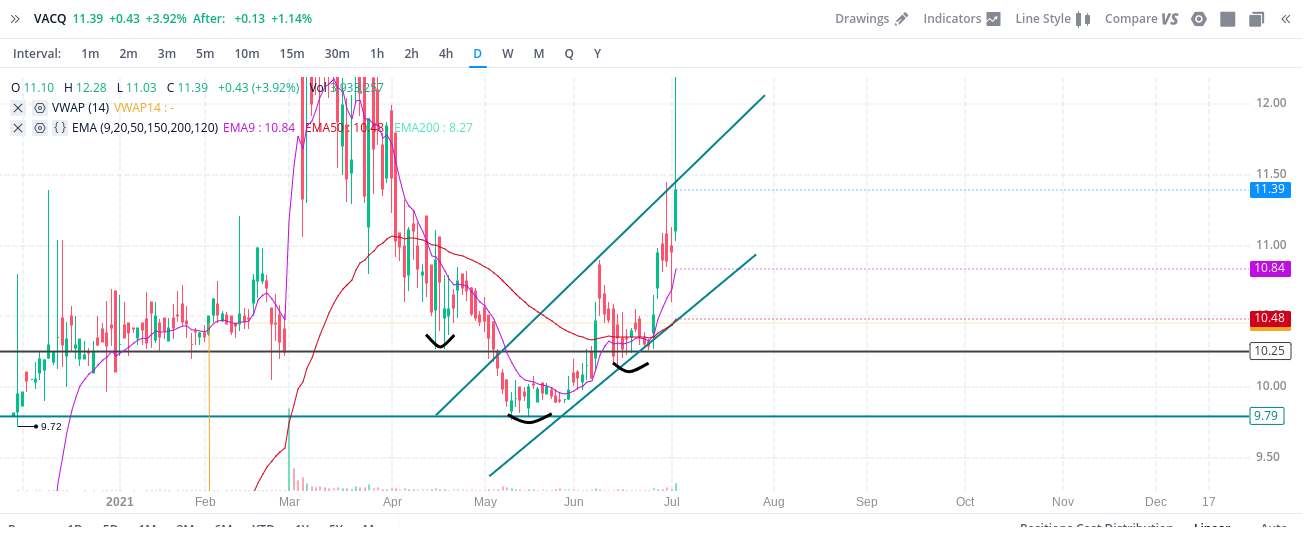
VACQ:
Booooo a SPAC! But, this one is for Rocket Lab which is an exciting player in the sector that does kind Starlink-ish things; they’re sending rockets to Mars but on a much slimmer budget than other companies like BA. They’re going with smaller Rockets which will be produced, eventually, on a wide scale that will allow companies flexibility for more trips.
VACQ Basic Chart: Looks like an inverse head and shoulders on the daily, and if stops out at the top of this trend then it’s complete and it’ll likely go down for a bit.
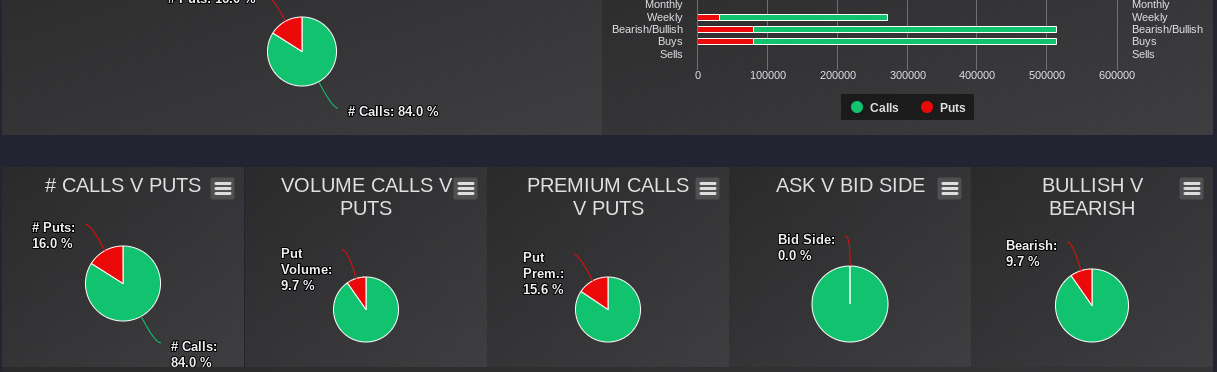
VACQ Flow: Surprisingly red after a good day Friday. Maybe it is at the top of the range in that chart after all?

ASTR:
After a 20% climb Friday after their SPAC merger with HOL, it seems like the sky’s the limit for this stonk (heh heh). They have an ambitious plan to launch rockets daily, and are a current favorite of Wall Street investors and analysts.
ASTR Basic Chart: Glancing at my basic-ass chart, my slowly growing TA skills tell me 15 is a support to watch, and it gets tired at 17. Though it’s been trading as a SPAC for a while, the stock itself is like two minutes old, so levels here don’t have as much value as others.

ASTR Flow: very green, but again not too reliable because the stock went up like 1,000% on Friday—most of this flow is skewed by Friday chasers, so buyer beware.
Queen Cathie’s ARKX Space Exploration ETF
If you want exposure to a wide variety of companies, this is probably the way to go. But, I’ll be honest, I don’t really like the distribution of companies they’re holding—and I don’t like the moves she’s made. When this ETF debuted she bought SPCE at the top, then in May she sold the dip. Now she’s on the sidelines holding bags of something called JD Logistics, crying as SPCE goes on a literal moon mission.

ARKX Basic chart: Grain of salt because ARKX has only been around for like 3 months, but it looks tapped out at 21.25. I probably wouldn’t enter unless it headed back down to around 20.50.

ARKX Flow: Okay I admit it, the flow LOOKS super green. But it’s got a very sparse amount of buys above the 1k+ premium, so the sample isn’t enough to consider it solid. Tempting, though.

LMT:
Wanted to do this one because they recently got a deal with GM to provide next-generation Lunar vehicles for NASA. A trusted company that’s a good hold anyway, maybe they get a boost from recent space excitement.
LMT Basic chart: Schroedingers cross—death cross here on the hourly but a golden cross visible on the daily.

Also, don’t sleep on the bullish rectangle on the daily between 371 and 390 (right)

RTX:
Not necessarily a space company, but they make lots of missiles and shit so I’ll count it lol. What I like is that it’s near the bottom of a trend and just bounced off a key support at 84. Here’s the hourly. Bullish.

RTX Flow Chart: Skewed a bit bearish so we’ll see if it falls to another support. I still like the stock, though.

NOC:
Northrop is a favorite of the Pentagon with billions in deals, and a very steady space player. They recently increased their space revenue by 29% in the most recent quarter. Your grandaddy’s favorite stock can quickly become your favorite with patience for entry.
NOC Basic Chart: Sitting in a channel between between ~360 and ~379 on the daily. Just formed a whole-ass cup and handle so I’ll be looking for entry if it dips back near 360 with potential to break above to new highs heading back up the channel

NOC Flow: Surprisingly bearish. In the short term I’d be patient for a drop to support before entering

And there’s space in a far-too-condensed nutshell. Hopefully this gives you ideas to ponder and a broader understanding of who players are besides the two dominating the news cycle. As Pop Smoke said, Shoot for the Stars, Aim for the Moon.
See you when we do next week’s sector recommendation. Thanks again @l0n3w014 for the idea.
🦇 Pt. 3: Build-A-Trader no. 3 (B.A.T. 3): EMA in Your TA.
A 101 guide to using EMAs in yo TA.
Welcome back! If you made it this far without blowing up your account then DAMN, you getting fancy. You know how to follow options order flow, you know to identify good LEAP candidates, you’ve learned about some prime uses of VWAP and, yes, you even know how to draw a questionable support or resistance line.

👍 Now we’re going to add moving averages to our arsenal—more specifically, the Exponential Moving Average (EMA). You may know them as those squiggly colored lines that make people’s charts look busy, but there are super simple applications that will help you become a better trader.
❓Why the EMA and not the SMA (simple moving average)?: The EMA is more weighted toward recent price movement, so for our purposes (and most other traders’), it’s the better of the two.
❓❓Which EMA(s) to use?: You can honestly use a lot or a little; as few as one or as many as, like, 7. If you recall B.A.T. 1, where we discussed the 9 EMA/VWAP crossover, the only EMA we cared about was the 9 EMA. We’ll expand a bit here: I typically keep five max on in my day trading (3, 5, 10 min chart): the 9, 20, the 50, the 150, and the 200. Keep in mind these aren’t hard and fast and a lot of people use other frames; it’s just what’s been working for me lately (until QS). For long plays I’m using the daily chart, and sometimes the hourly.
Between shorter and longer EMA choices, the key difference is that shorter term EMAs let you detect a trend earlier, but are less reliable. Longer term EMAs are more solid, but they take a while to develop and leave you a bit behind the curve as to what the price movement trend is. We’ll review some strategies for both; let’s get to it.
Short-term strategies:
Short term support and resistance levels
📏 I’ve found that the shorter EMAs tend to work well as support or resistance in addition to the pivots and horizontal lines I have. Often times this is simply a stock “respecting” a certain moving average by either a) treating it as a legitimate support or resistance or b) sort of “crawling” with the EMA, sticking tightly to its movement
Monday live example X: X shows support at the 150 EMA, with two candles closing above each time it touched it. So, this shows an EMA acting as a clear support.

Wednesday live example LMND: moving along beneath the 9 EMA, hitting resistance as it touching, multiple candles in a row. If the 9 EMA continues downward, your boy is out.

Short term crosses:
❗️When a shorter EMA crosses above or below a longer term EMA, it’s considered a fairly reliable bullish or bearish signal. For these shorter intervals like the 3, 5, and 10 minute, I typically use the 9 EMA, with the 20 EMA as the first level I’m intrigued by, then usually bite on the 50 if I like the way things look with the indexes.
Short term cross example LMND (same session): Later in the session LMND recovers and the 9 EMA crosses above the 50 EMA here. This is when I buy.

Did it hold? Let’s check in 20 minutes later:

💎 It held nicely, following above the EMA for some nice green candles to make some easy profit on the trade.
Another live example from the same session is BIDU this week:


I caught this one just as the 9 EMA (purple) crossed the 50 EMA (red). I knew there was bullish momentum due to the 9 EMA/VWAP cross occurring which we taught in YEET number 8. Here BIDU is at 205 when I pulled the trigger. Where was it thirty minutes later?
BIDU hit 209 on a nice momentum play that very quickly netted us 50%.
❗️ A simple way to think of it: if we’re riding above an EMA we’re in an uptrend, and below it we’re in a downtrend. Each time a shorter EMA crosses above or below a longer EMA, we are adding a degree of confidence.
⭐️Bonus: You can add a final level of confidence by waiting for the price to “retest” the EMA it just crossed, to see if it will hold as support or resistance after touching it again.
Long-term strategies
Alright, we gotta switch to the daily chart for this one, which I hate because it means these plays require patience (or, as the kids say, PAYtience).
❌ Cross-over strategies:
The 20 EMA crosses over the 50 EMA on the daily chart
Pretty straightforward, the shorter time line goes above the long-term line
A key necessity: You must have two successful retests of the area between the 20 and 50 EMA after it crosses. It doesn’t HAVE to be the area between, so long as it touches the EMA again.
20 EMA/50 EMA crossover example BKNG:

📈 Now we (ideally) ride our stonk up, and we’re gravy as long as we keep trading above the moving averages. So, when do we sell if we’re bullish? When the price closes below the 50 EMA. Looking at the BKNG chart we would sell in the yellow circle, then:

🐻 Wanna go bearish? Same principle applies...but...because sells tend to come at faster momentum (stairs up, elevator down), we can go ahead and enter our short position after one retest of the area between the 20 EMA and the 50 EMA, rather than two.
Let’s see if we can ride BKNG back down for more tendies after riding it up:

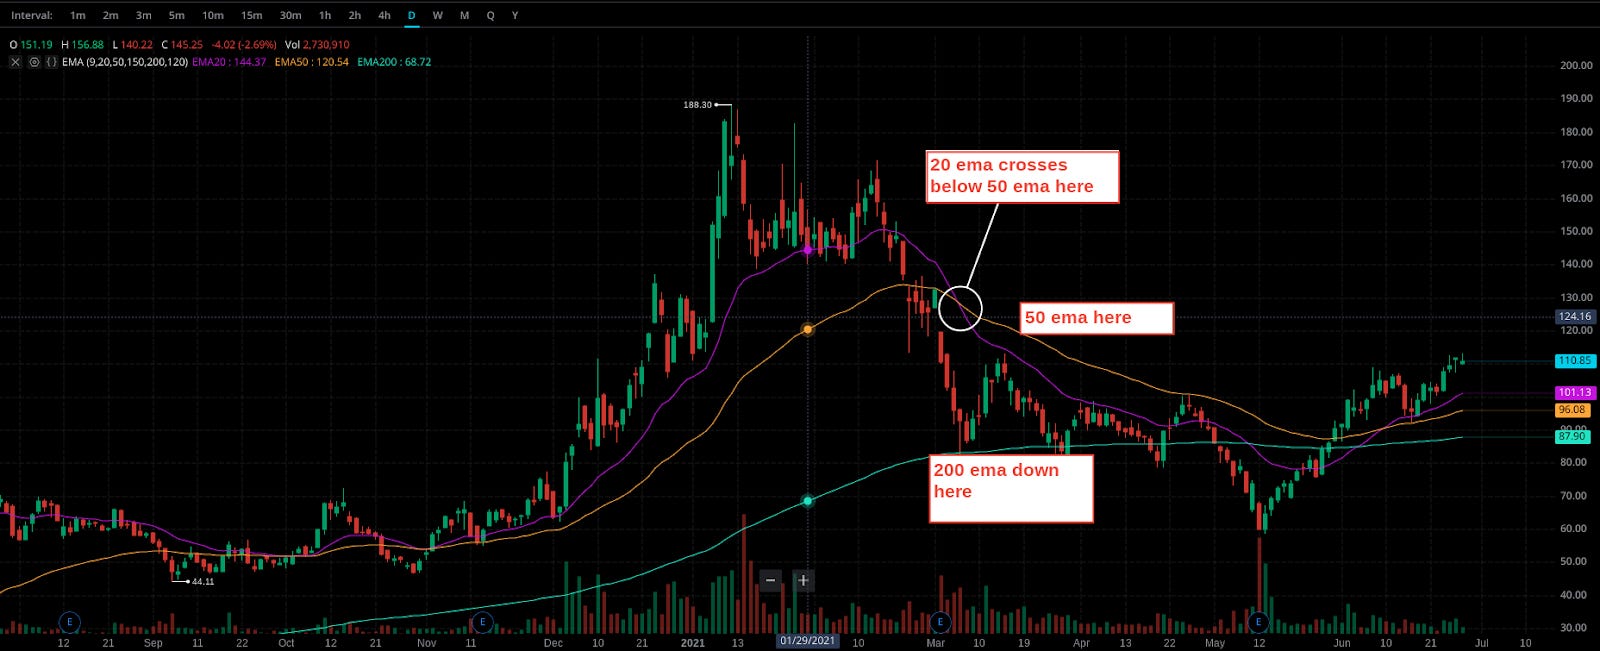
⭐️ Bearish bonus!: If the 20 EMA crosses beneath the 50 EMA WHILE the 50 EMA is above the 200 EMA, this is an incredibly bearish sign. Why? Because it is. Let’s look at LMND’s chart as an example:
⭐️ Bonus: One important thing about using shorter term EMAs is that you can get “whipsawed”, which is sent back and forth over and under an EMA with erratic price action. I’ve had luck with this by checking the chart of the index of my ticker, and ensuring it’s not at a support or resistance level that may drive me back down or up.
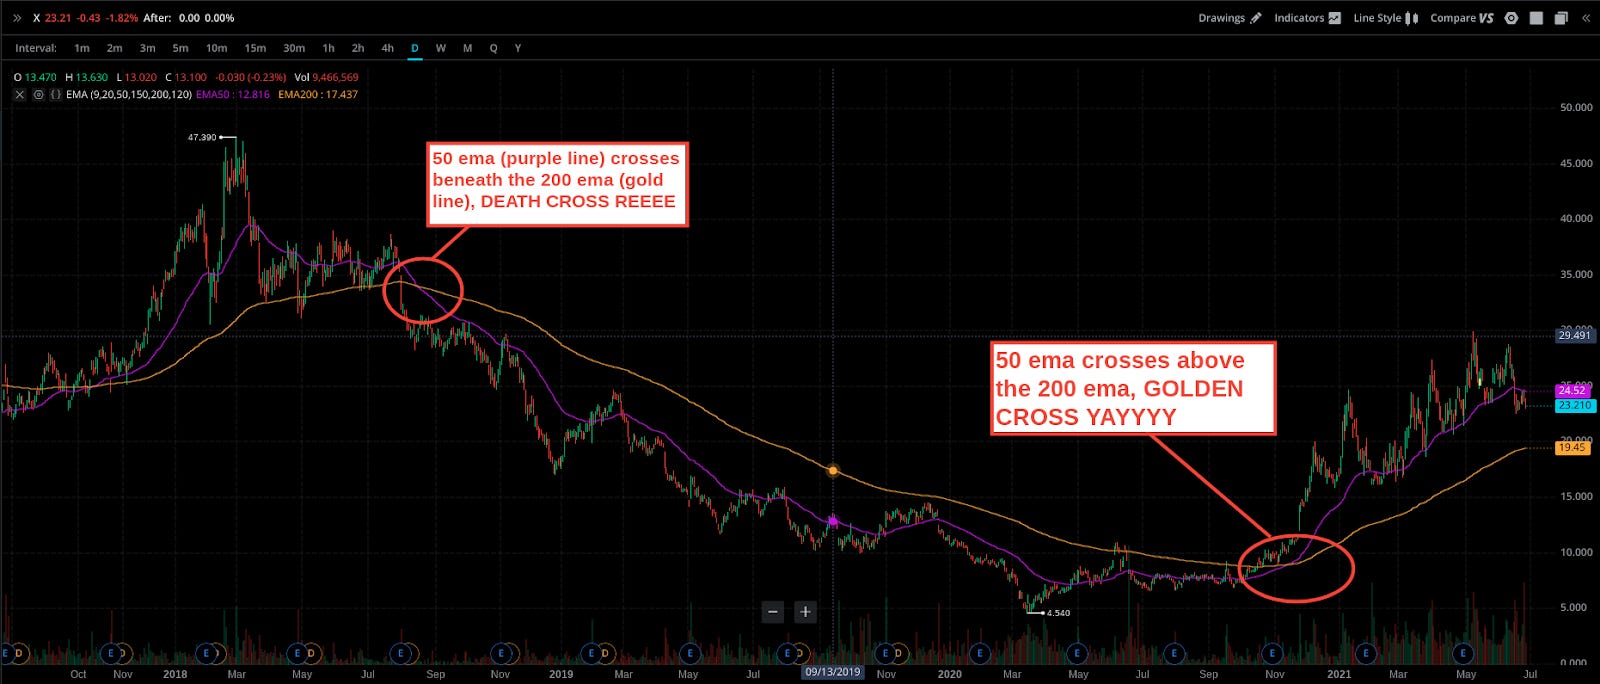
Golden Cross & Death Cross
With dramatic-ass names like this you would expect these to be important—and they are. Just like you’d assume, the golden cross is bullish AF and the death cross means impending doom for a ticker.
Basic Principle: A shorter term EMA crossing above (or below) a longer term EMA. Typically this is on the daily chart, and using the 50 EMA and the 200 EMA. So, if the 50 EMA crosses above the 200 EMA you’ve got a golden cross, and if the 50 crosses below a death cross. Let’s use my recent favorite stock, X, where we can see both occur.
There are a ton of applications for the EMAs, but this feels like a good amount to get started with and not get overwhelmed—especially if you’re trying to start working these in while you’re using other Build-A-Trader methods. Some quick review:
With shorter term day and swing trades, we’re looking for EMAs to hold as basic support or resistance levels, and to looking for the shorter term EMA (like the 9) to cross over a longer term one (like the 20 or 50)
With longer term share and LEAP plays, we’re looking for the 20 to cross the 50 EMA and survive a retest, or the golden/death cross, where the 50 crosses above or below the 200
How I’d recommend splitting this up is to try using the short term applications for a week, maybe one or two EMAs at a time if this is new for you. Also keep a watchlist of impending crosses for longer term plays.
👏 And, congrats, you now have another tool to help you overthink how to lose money! I’ll be using these principles on my twitter, and we’ll likely do some B.A.T. review soon to take a breather and analyze examples of success and failure with these tools.
Later!
🗣Pt. 4: Look Who’s Talking: Market Sentiment Tracking This Week.
Contributor: @mkt_sentiment
Tracking Stonk Chatter with Market Sentiment
Editor’s Note: Alright YEETers listen up. We’ve got a special guest, so act normal. Give them the warm YEET welcome and make you sure you follow their great work @mkt_sentiment
Market Sentiment is a newsletter for investors and traders interested in learning about stocks that are exhibiting accelerated growth. They analyze multiple data sources (Twitter, Reddit, News Articles & Blogs) in real-time to accurately track the market sentiment for all the major companies. They also do a comprehensive deep-dive on one investment strategy/topic every week! Access the weekly reports to make the best investment decisions. You can check them out here.

What is sentiment: It's calculated using natural language processing with a modified version of vadersentiment. You get pre-trained models which classify whether a given statement is positive or negative. I have modified it to analyse financial comments also (eg. Calls, puts, moon, gain, loss etc). It then classifies the statement between -100% and +100% depending on if it's negative or positive respectively. The numbers you are seeing here is the average across all the comments. here is a sample of the sentiment analysis I posted when Boeing's engine failed on UAL flight.
How does the program work: The program is built using Python and uses both Twitter and Reddit API to stream comments and tweets and spot tickers that are exhibiting accelerated growth. I added sentiment analysis to the findings so as to check the general sentiment (whether what is being talked about in the stock is positive or negative).

Now Presenting: The Top Stocks of the Week!
S&P 500 hit a new high (1.7% WoW increase) following Friday’s strong job report (U.S. economy added 850,000 jobs, the most in 10 months). This marks S&P 500 rise for the 7th straight day, the longest winning streak since last August. Even though the market had a strong rally, almost all the popular stocks took a significant beating in the past week.
Most Discussed Stocks of the Week

This is the first time where all the popular stocks except SPY ended in red the same week. This week's stock returns also illustrate the need for effective diversification of your portfolio!
WISH continues to be the most discussed stock, but its sentiment took a significant beating following the 17% drop in the stock price in the past week (dropped to 4% from 46%). The best performing stock on the list was BlackBerry which almost recovered all its losses following the company’s earnings report. A newcomer to the top 10 list is Virgin Galactic following the announcement that its next spaceflight test will carry founder Sir Richard Branson.
Top Growing Stocks of the Week

Above is the list of stocks that have exploded in the number of mentions throughout social media.
Micron Technology($MU): MU released its Q3 quarter results on June 30th, beating both revenue and EPS estimates. Even though the company had strong quarterly results, the stock tumbled 5% following the earnings due to raising capital expenditure forecast. Investors believe that this is just a minor blip as the company has reported impressive revenue growth of 36% (YoY) and a gross margin of 42% and MU can expect strong demand from the data center, PC and graphics, mobile markets.
Virgin Galactic($SPCE): SPCE had a wild week with the stock jumping 23% on Friday after the company announced that its next spaceflight test will carry Richard Branson. The launch is expected to take place on July 11th and marks an attempt to beat Jeff Bezos after he announced that his company (Blue Origin) will have its first passenger spaceflight on July 20th. SPCE stock, in general, had wild swings this year with the stock climbing above $60 in February and then falling as low as $15 in May.
Vuzix Corp($VUZI): VUZI is considered to be at the forefront of the wearable smart eyeglasses industry. The company was generating discussions as it gained almost 8% mid-week before dropping down. Investors seem to be extremely bullish on the stock as reflected by its sentiment. The stock has experienced very large swings this year with it starting at $8 in Jan and rallying up to $30 in April before dropping down to its current level of $17. Still, the stock is up 109% YTD.
Paysafe($PSFE): Paysafe is a payment platform that enables payment processing, digital wallet, and online cash solutions. The company is trending as it had recently announced its partnership with Microsoft and is now enabling online cash transactions on Microsoft Store. Adding to this, the company also announced an expanded partnership with FOX Bet.
NIO Inc($NIO): Chinese electric vehicle manufacturer NIO has now climbed more than 20% in the last month. This strong rally is generating more discussions about the stock. In addition to this, analysts’ recommendation has also become more bullish for the stock with Citigroup‘s Jeff Chung issuing a price target of $72 from the current $50 level. This is predominantly driven by the company’s excellent shipment volume, with NIO confirming they have delivered 8,000+ vehicles in June and 21,896 vehicles for the entire second quarter.
Honorable Mentions: ZIM Integrated Shipping($ZIM) got a boost in mentions following this excellent Due Diligence that was posted on wallstreetbets which showcased the company is a good long-term play. Intellia Therapeutics($NTLA) was also trending following their announcement that they have successfully corrected a hereditary disease ATTR amyloidosis, with a single infusion of CRISPR, a programmable gene-editing tool. The stock jumped 50% on the news but dropped down to a 15% gain over the last week.

Editor’s Note: That’s a wrap, and we’ll definitely be having @mkt_sentiment back for more tracking soon, if he’ll let us. Happy Hunting!
👀 Pt. 5: The Whale Watchlist Picks
Made possible with help from the @unusualwhales Alerts and Flow Tool. Sign up here!
Milt’s WatchList:
📞Calls: ⭐️JMIA, DASH, ABNB, FUBO
👿Puts: MRNA
⭐️ = Milt’s Pick
1. ⭐️JMIA Calls
Alert almost 6% outside the money and expiring this month, I like this play because 1) JMIA still had great flow to close out a really brutal day Friday and 2) it’s creeping right at support on my lil chart here.
What we like: Ask-side, OTM, flow against the price action
🐳 JMIA: Unusual Whales Alert

🌊 JMIA: Flow reading

📈 JMIA: Flow Chart
📉 JMIA: Chart
Hourly—Looks like it might have found solid support here around 26.50 after a (hopefully) completed head and shoulders. My targets: 28, 28.45, 28.88, 29.31

2. DASH Calls
On a little run and I KNOW everyone from the Homeland likes to short the shit out of them. That being said, it seems like not a bad momentum play to hop on with this 8% OTM Whale Alert.
🐳 DASH: Unusual Whales Alert

🌊 DASH: Flow reading, (admittedly mixed, use caution)

📈 DASH: Flow Chart

📉 DASH: Chart
Moving up in a trend and trying to hit an all time high.

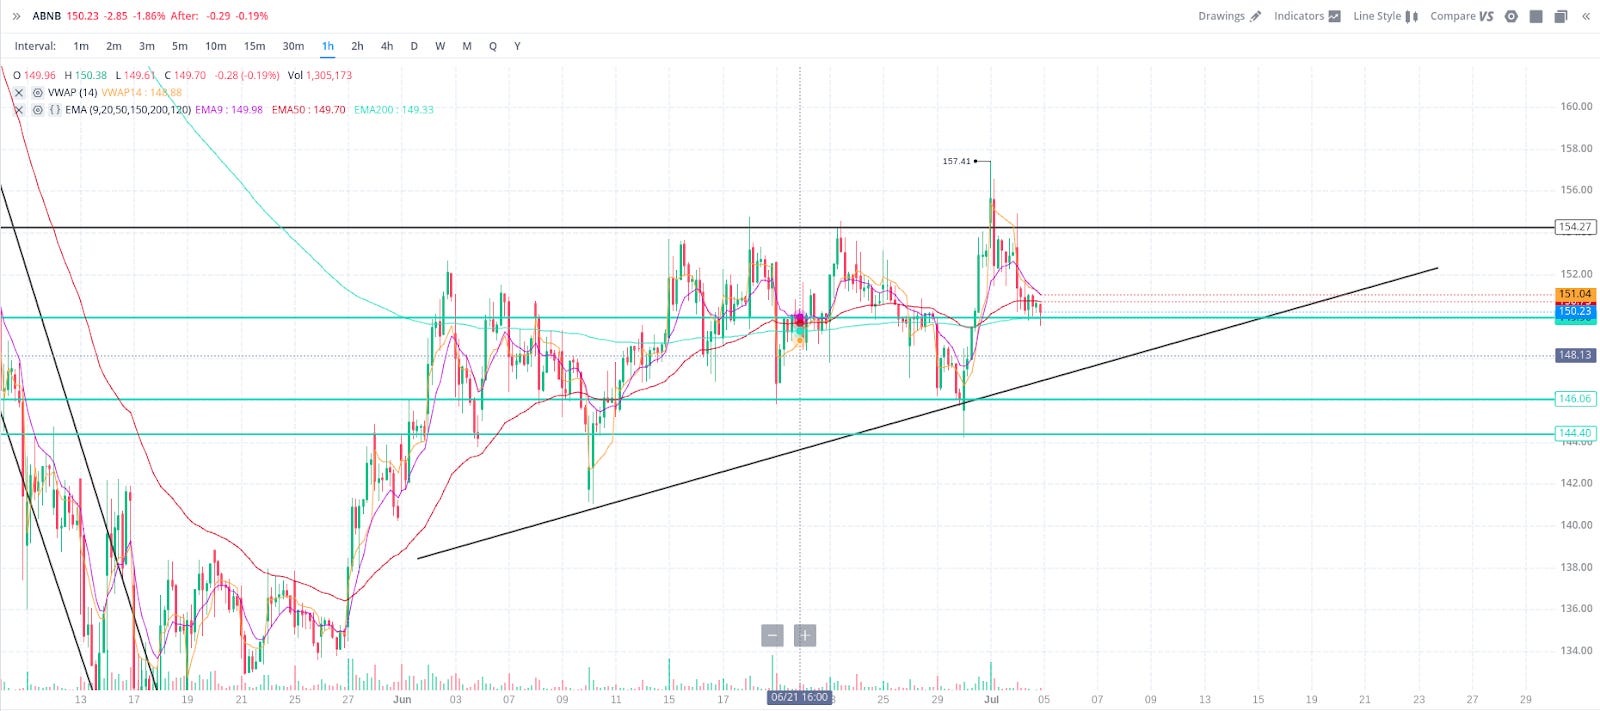
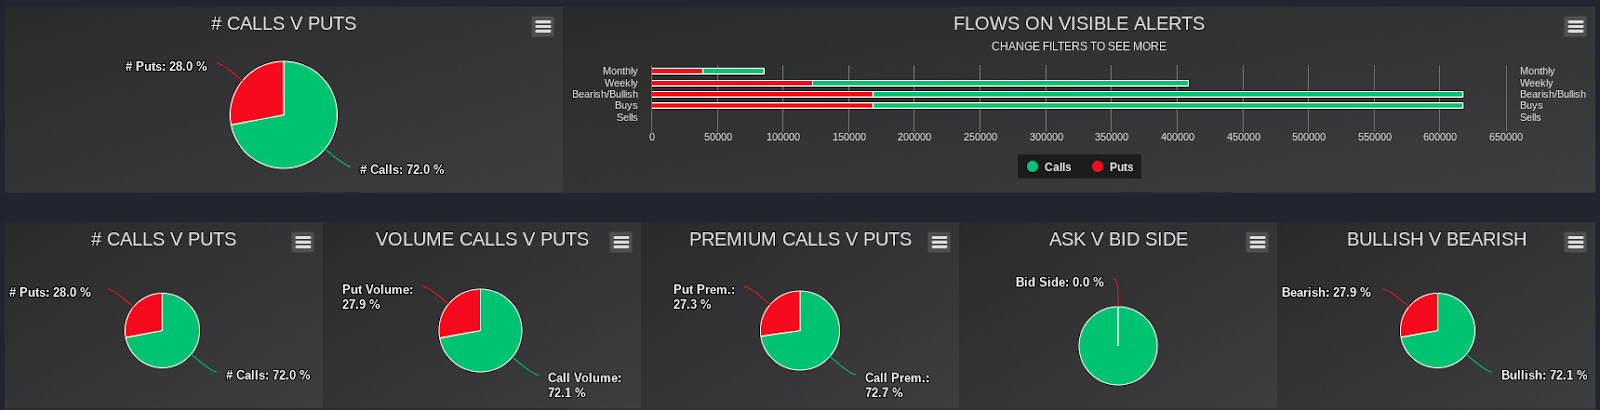
3. ABNB Calls
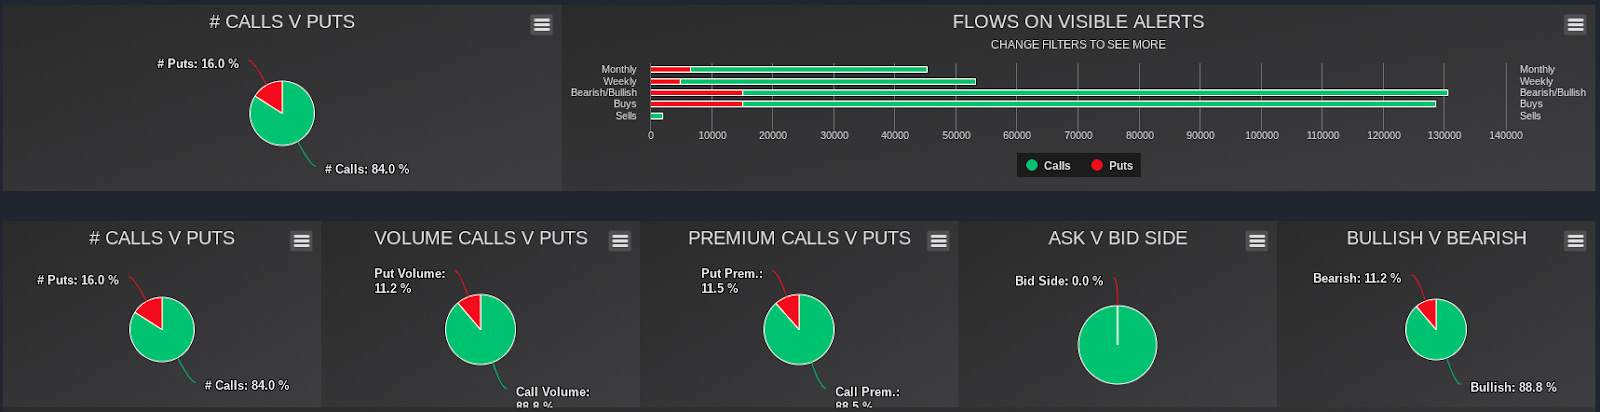
Deeeep outside the money call here. What I’m really liking beside the speculative bet is that it aligns with potentially good reopening news, AND that the flow went against the price action.
🛍 We like: Ask-side
🐳 ABNB: Unusual Whales Alerts

🌊 ABNB: Flow reading

📈 ABNB: Flow Chart

📉 ABNB: Chart
Ascending triangle and at a support. Tried to break out to the upside once if it gets the bounce it may go this time
4. FUBO Calls
I don’t typically like to fish bottoms but hot damn this thing has been slaughtered. It’s super high-risk/high-reward, and seeing a couple alerts and the flow chart even while it’s tanking makes me mad boolish. This 6/25 is 28$ outside the money lol, and the recent one is 6%. I’ll take the odds here and not bet more than I can lose.
🌊 FUBO: Flow reading

📈 FUBO: Flow Chart
📉 FUBO: Chart
Looks like a cup and handle forming on the hourly—but who knows lol. Somebody PM me a correction or some confirmation bias please and thank you.

5. MRNA Puts
We’ve done a longform DD on them before and I generally have liked the stock, but after this blistering variant efficacy it makes sense to deflate at some point. This person is betting on a quite a drop, and I’ve definitely heard of bets that make less sense.
🐳 MRNA: Unusual Whales Alert

🌊 MRNA: Flow reading

📈 MRNA: Flow Chart

📉 MRNA: Chart
Breaking down out of it all pretty much lol—channel, wedge, you name it. Anyway, somebody going this deep outside the money says it’s more speculative news than chart shit.

Pt. 6: Weather: SPY & QQQ Forecast & Watchlist by @daarkmaagician 🌦
Below is the chart & info for a SPY & QQQ forecast from @daarkmaagician, his DISCORD is the place to be (YEETers get two weeks free!). I’ve attached his accompanying text as an image with the photo below. We’ve also included his WATCHLIST below.
SPY/QQQ Charts Legend:
Solid Blue= ATH, Green= Dark Pool Buys, Red= Dark Pool Sells, Purple= Dark Pools, Orange= Supports/Resistances, Teal= EMA
SPY & QQQ FORECAST
SPY charts below:


QQQ charts below:


Dark's Watchlist Pt. 1: LONG SCANNER
Dark's Watchlist Pt. 2: WEEKLY TREND
❗️A note from Dark: Please remember my watchlist will take time to develop. It can take few days to a couple weeks to start going, be patient. Most importantly, don't try and play every single one. A good suggestion is to make your own watchlist from these that you are most familiar with. Have mental stop loss areas set in case anything goes south Enjoy!
Make sure you follow @daarkmaagician to get updates on the indexes daily!
Pt. 7: TLDR & GOODBYE ✌️
TLDR:
Pt. 2: Space sector investing
Pt. 3: Uses of EMAs
Pt. 4: @mkt_sentiment market chatter tracking
Pt. 5: Watchlist: 📞Calls: ⭐️JMIA, DASH, ABNB, FUBO - 👿Puts: MRNA
Pt. 6: SPY and QQQ Index Forecasts & Watchlist
Goodbye and thanks for reading! Questions, scoops, comments @yourboymilt or /u/alldatdalton. See you next week! ✌
you wanna share your ref code for unusualwhales?