

YEET no. 16: 30 for 30—Three Nights in March
YEET no. 16: 30 for 30—Three Nights in March
Welcome to The Yeet, a weekly DD where we try to tilt the casino...

Hey! I’m @YourBoyMilt, and welcome to retail’s Sunday Paper.
A big welcome to The YEET! I should probably let you know...This is not financial advice! We are here to entertain while giving you ideas, perspective, and angles. Do your own research, I prithee. And if you aren’t subscribed, join us here:
Creator/Editor:@YourBoyMilt The Architect: 🧠 Publishing Associate:@YourGirlRachie
Pt. 1: Week’s Thoughts, Pt. 2: Return of the Spac (@billspacman), Pt. 3: Build-A-Trader (B-A-T) 6: Pattern Spotting Pt. 2, Pt. 4: Stay Out the $ Hood? (@mkt_sentiment), Pt. 5: Watchlist, Pt. 6: Index Forecasts (@daarkmaagician ) Pt. 7: TLDR
🏀 Pt. 1: 30 for 30—Three Nights in March
What if I told you that you had the chance to do it all over again?

It’s halftime in the sector rotation of our lives, and the motivational tales are told of the 2020 market collapse caused by a Covid recession that’s now a distant memory. Oftentimes the cultural watersheds around an event obfuscate the reality, and the March 2020 market crash is no exception.
Covid was only the tipping point. The market ran hot in 2019, delivering a blistering return of 28% for the S&P 500 and 35% for the NASDAQ—a miraculous occurrence following a tumultuous 2018. After that disastrous year—which came .2% away from officially closing as a bear market—the bulls roared in 2019 as AAPL and MSFT became trillion dollar companies for the first time. The market of 2019 was a Hail Mary, a three at the buzzer, a deliverance of unexpected jubilation under the pressure of certain defeat.

The buy-now-ask-later heroics of the 2019 Bulls are lost on a new generation of traders; the legend is now just a faded memory, a gritty black-and-white TV showing of a classic game with a relevance long since faded. The uncertainty into 2019 is best described by this CNBC article that may as well have been written this January:
It was a year filled with fears that were never realized: a global economic slowdown, disruptive trade wars and potential missteps from Federal Reserve policy. The year also revealed an unforeseen boom in the tech sector that drove the major stock indexes ever higher.
Sounds familiar. The 2019 boom was engineered by the same maneuvering the Fed’s now famous for in our new age of pop-culture economics; tinkering with interest rates and regulatory massaging of at-risk markets (see: what they did with the Repo). The necessity of playing defense in 2019 was a forced hand; the Treasury Yield had inverted—an economic warning signal that’s a perfect 7 for 7 in predicting recessions—and the most respected of economists were then calling for a recession in 2020. By all measures of reason and fundamentals, the market was already on fragile footing heading into last year.
Then came Covid-19 and the deepest, swiftest bear market of our generation.

The misguided sense of security that Americans felt vanished as sickness arrived on our shores. The financial markets finally gave way to reality, and on the night of March 8th the roof caved in. Prior to opening on Black Monday, March 9th, futures markets experienced the first of a wave of circuit breakers. Dips were briefly bought before more dark days; Black Thursday on March 12th and Black Monday II, the following week, were equally as bloody. The whimsical divergence between market and reality—which investors enjoy as their Jay-given right—was, seemingly, irrevocably broken.

Then came the miracle. Jay Powell down 7, ten seconds left in the game, ball at his own 1 yard line and...a beautiful spiral down the field that launched the most jaw-dropping bull run we’ll ever see in our lifetime. THIS. MAN. BALLED. OUT. In one fell swoop, federal policy not only cancelled a recession caused by a worldwide pandemic, but it also managed to sweep the impending economic crash predicted in 2019 under the rug. The once victorious bears were sent out of the stadium in defeat, suffering a bitter loss as green days rained down like so much confetti.
The “buy the the fucking dip” generation had arrived.

As newer traders trickle in to the aggressive options market, many of us are forced to ask ourself the question; if we had known the full range of trading tools at our disposal on those three nights in March, how fucking rich would we have become. It’s a tempting fantasy to believe we’d know just how to respond to a plague, when to short the market and for how long, when to buy the dip and just how long to HODL it. It’s even more tempting to ignore the confluence of factors which brought about last year’s improbable recovery, and believe that talent and conviction created this generation of meme millionaires; the scrappy and inexperienced Robin Hood rebels who clicked the buttons that sent them to Valhalla. Did you miss the game?

Well, we say it’s the year 2021 but in reality it’s the year 2019—the improbable recovery from a probable crash, the issues the same as we emerge from the shadow of an overextended use of Fed policy tools. Tinkering with the Federal interest rate? Yes. An overheated tech run giving mega-cap stocks valuations that dwarf the GDP of advanced economies? You bet. And, most importantly, the looming threat of a surging virus that threatens to dismantle all of it—first slowly, then swiftly, then damningly.
The Delta variant arrived in disregarded headlines from disregarded countries, making small waves that led to disinterested shrugs. Then it arrived on our shores, taken by all with a lukewarm sincerity and a grain of salt. Now it’s become a ghost of future’s past; delayed office reopenings, postponed weddings and vacations, and, of course, the wearing of those Mother. Fucking. Masks. This is the blast from the past that nobody wanted, closing our proverbial Disneyland.
What if I told you that you had the chance to do it all again?
All of it. The fear of futures, the obsession over news, the predictions of impending falls, the deified buying of dips at the depths. The hand-wringing over vaccines and the rise of the VIX, the tumbling of travel and the FUD from CNBC. The excitement of the unknown, the rush of the unpredictable, the dopamine-delivering anxiety of the overnight hold. The YOLOs, the yeets, the GUHs and the REEs; our saving by The Fed while we can’t even stave our own dread.

Like it or not, this is where we are:


And ready or not, this is all you’ll see:


Could a dual be on the horizon? Two players leaping for the ball during the tip-off?

With the chance to do it all over again, what will you do? Will you buy the dip or will you sell the rip? With people stuck at home will you bet on another rocket for tech, or is your money on the fall of the entire market? Will investors ignore the new crisis—letting us yeet fundamentals and caution to the wind—or will this round of illness, finally, bring the bursting of the bubble that we’ve all blown into.

Next week in the quiet of night, staring at the candles on investing.com, you’ll try to make sense of the senseless while the news stories pile up. What’s the right decision? Are investors truly witnessing a new world, a market running on more willpower than energy, tapping into an unforeseen gear like LeBron in the final seconds of that improbable Championship?
Or will we see the Blackest of Mondays, a market teetering into the abyss, the plummeting of portfolios to destruction as they did those Three Nights in March?

Welcome to YEET no. 16, brought to you by Game 7.
👶 Pt. 2: Return of the SPAC
Discussing the potential comeback of SPAC deals with a foreword by @billSPACman. Check out his newsletter for DAILY (yes, daily) SPAC articles.
Two thoughts came to mind when I saw that NKLA founder Trevor Milton was indicted on charges of fraud for duping his investors by rolling a truck down a hill.
Thought 1: lol
Thought 2: Didn’t NKLA go public through a SPAC? I don’t know shit about those.

Well, serendipitously, earlier this week @billSPACman and I DMed a bit, and he directed me to his SPAC newsletter http://subspac.substack.com. There are very few other substacks I am willing to read, because I am as lazy as I am busy, but I found this one worth my time because it covers an area too niche for me to even try to keep up with. With so many SPACs struggling recently, I asked my dude SPACman for an ELI5 primer and his thoughts on the current state of SPACs:

You’ve probably heard or seen the acronym “SPAC” floating around in the last couple of months → it’s an investment vehicle that took Wall Street by storm. SPACs are shell companies that raise money from investors through stock-market listings, and after going public themselves, they look for private companies to buy.
We’re at an inflection point in the market. SPACs have been poised to change the IPO landscape forever, but they’re still…in their infancy. That makes them a little hard to assess. I think the SPAC is a novel idea, and while it may not be successful in the short term, some companies that are currently SPACs have the potential to become major players over the long term. It’s like ‘Field of Dreams:’ If you build it (a SPAC), then they (buyers) will come.
Thanks Bill—much needed optimism for the SPAC Bagholders Club. See, last year this SPAC shit was all the rage, and some popular companies that went public via SPACs include DraftKings, Virgin Galactic, and ChargePoint. For a while SPACs seemed like every “buzz” company’s debut vehicle for a big payday, especially in the nascency of Covid—when traditional routes for public listing were logistically impossible. Now? The SPAC dip is upon us, and there are a few major reasons:
Valuations: Share prices for SPACs got inflated in last year’s market just like everything else. Though fair value was thought to be around $10 a share, research shows that in the hangover after their COVID run, SPAC real values fell, on average, as low as $6.65.
Deals are sometimes hard to clinch: SPAC shareholders have to vote to complete the merger, and us retail raiders have such short attention spans that some SPACs need to advertise in order to remind their shareholders to vote.
Shade: Companies like RIDE have had post-merger issues with what can be described as “Shitty Due Diligence on the part of the acquiring company”. The spreading concern that investors could potentially be buying a lemon has cooled the market.
It’s been a cocktail leading to many-a-GUH for Acquisition Gang. Worry not though, bagholders, as apparently the issues won’t last long:
News that the US Securities and Exchange Commission is preparing tighter regulations also dampened interest, but Mr Khairajani says this could trigger a SPAC revival by reducing risk and improving the quality of management teams. “The SPAC fashion may recover and next time it could be rewarding as well as speculative." SPACs are far from dead. UK Chancellor Rishi Sunak is now reviewing how to introduce them into the City of London to boost tech start-ups.
This news that SPACs are creepin’ on a come-up is all the more reason to subscribe to @billSPACmans newsletter. There are too many of these things for me to even try to keep up with, which is why I never talk about them, but SPACmans daily e-mail gives a pretty solid rundown. Now, you too can profit off the Trevor Milton’s of the world in their quest to go public and complete market domination.
Anyway, I know why y’all check out this newsletter; it’s time to get those A-1 reads on the sector we’re covering. So, without further ado, here’s a YEET read on a few SPACs: SOFI, LCID, and, because it’s funny to me, NKLA.
SOFI Read:
A lot of things I like in this read, but Cramer recently said it’s a buy around $14 so we know what that means. But, I like it to hit 20 this year, and upcoming earnings could be the little push our baby meme needs.
🌊 Flow Read (5k+): Things are looking a tad bit bearish for their earnings run, as they’re scheduled to report on August 12th. Friday’s flow was 62% bearish, but you can take it with a grain of salt, as pretty much everything took a dump that day.
⌚️Expiration: There was a roughly equal split between bearish and bullish action on the 8/20, which makes sense as it’s the monthly expiry just after their earnings. What may stick out as mildly concerning to the SOFI bulls is the large bearish spike in premium on the 2023 LEAP.
🔨 Strike: Bearish hits on all different strike prices throughout the Friday session, with the 17.5 and the 20 seeing the most activity.

📈 SOFI Chart:
Really like this bull flag on the hourly. Why? Because it’s been holding 15.45 quite nicely.
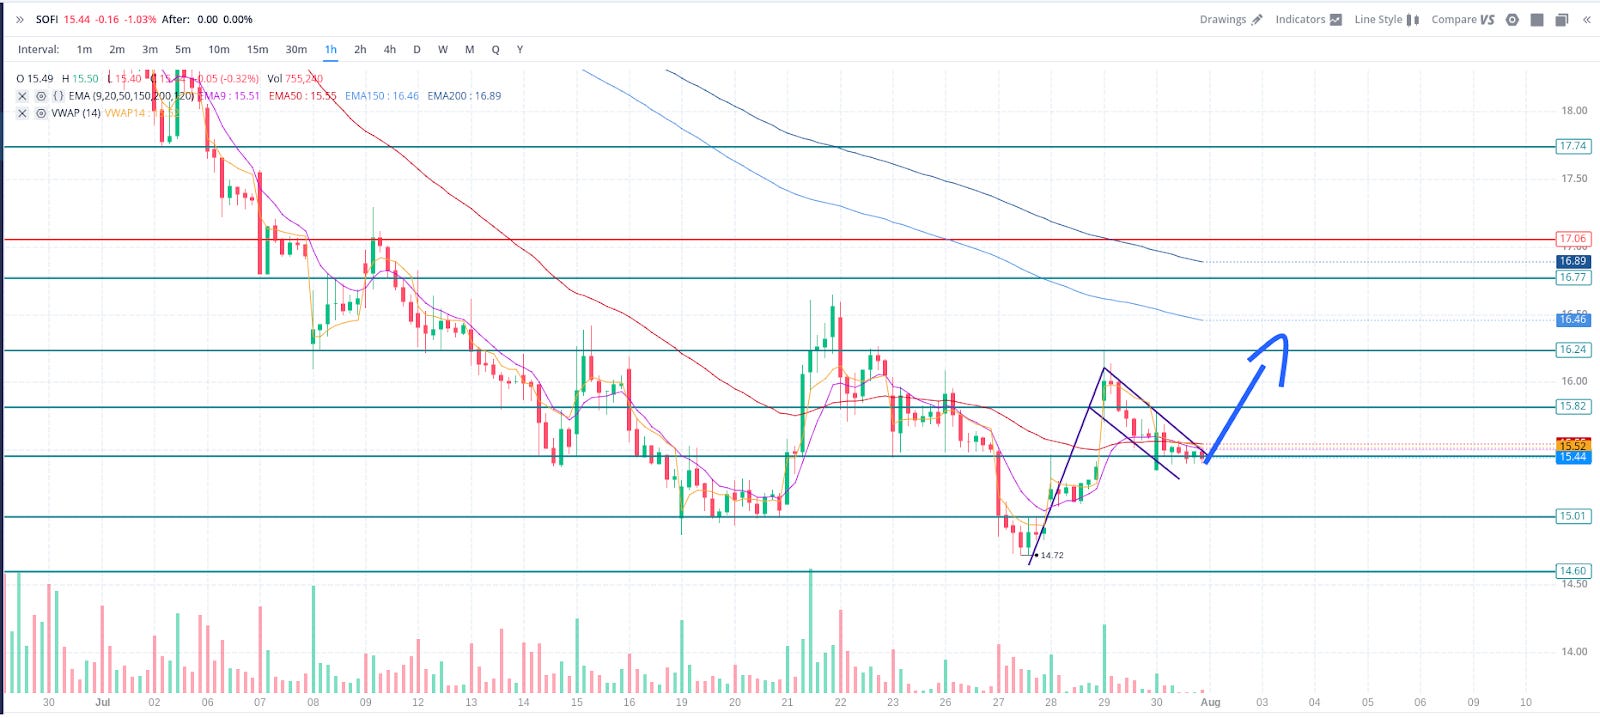
📝 SOFI Levels:
Upside: 15.82, 16.25, 16.75, 17.06, 17.44
Downside: 15.30, 15, 14.60
LCID Read:
With its merger complete, I am hearing projections like $50+ for true value. In the crowded EV space you’ve got to tread carefully, but investors are REALLY excited about this one (upcoming EV shit in the Biden administration certainly helps).
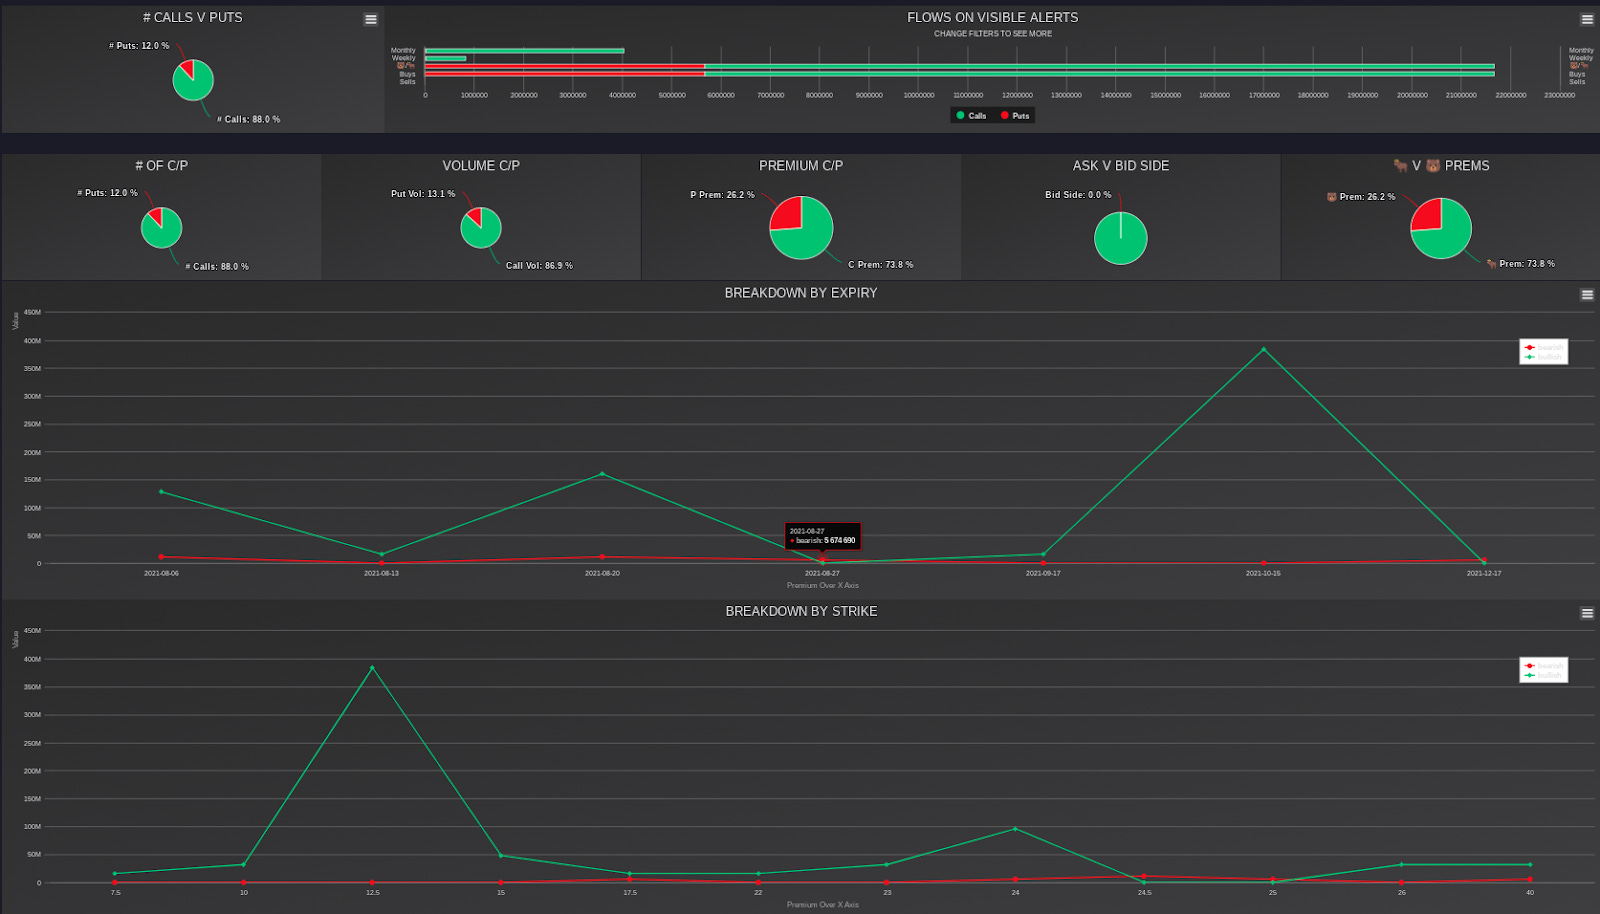
Flow 5k+: LCID had a great day Friday with the flow to match—racking up 73% bullish premium volume and 1.65% increase in underlying during a bloody red day.
Expiration: Big-ass spike in bullish premium on the 10/15 expiry.
Strike: Almost all the bullish attention was on the 12.5 strike
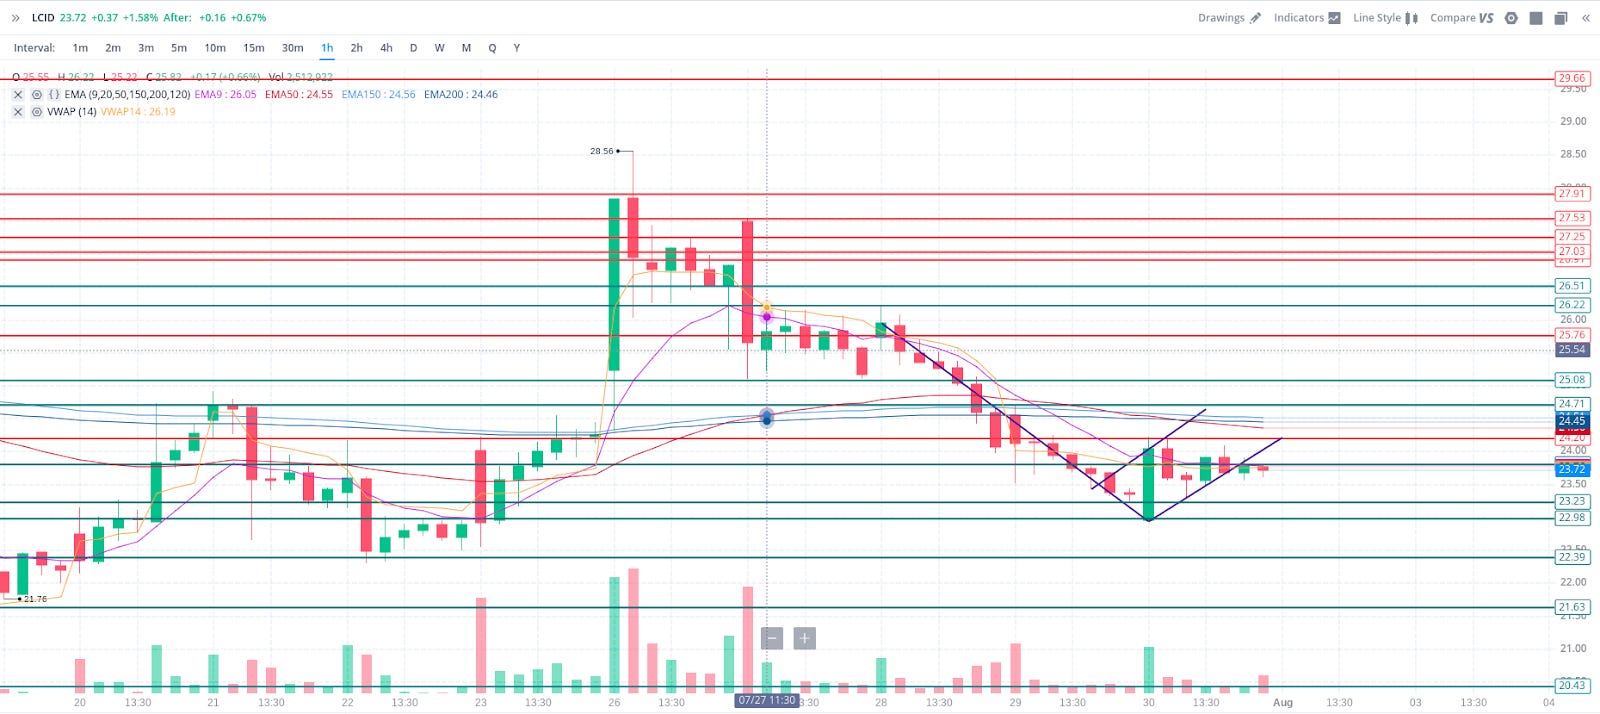
📈 LCID Chart:
On the daily it’s broken beneath the 50 EMA and has a ways to go before support at the 150 and 200. I’m keeping an eye on that bear flag on the hourly for short term bearish movement.
📝 LCID Levels:
Upside: 23.81, 24.20, 24.70, 25.10, 25.75, 26.22
Downside: 23.23, 23, 23.40
NKLA Read:
LOL yeah fuckin right 😂

And that’s that! I’d again like to thank @billSPACman for sharing his wisdom. Seriously guys, just sign up for the newsletter; if you did you’d probably be dining on LCID tendies right now. Personally, I cannot wait for YEET to go public in a SPAC deal for the YEETmobile—an EV that runs on nothing but hopes, dreams, and the tears of bears.
Later!
🦇 Pt. 3: Build-A-Trader (B-A-T) 6: Pattern Spotting pt. 2
Congratulations, at this point in B-A-T you’ve learned some shapes! You are now essentially a FinTwit-level TA FURU; I look forward to seeing you “call the top” 50 times a month until you’re finally right, at which point you will brag endlessly. This is the way.
There are a few patterns we didn’t get to last time that will make you even MORE big-brained:
🇺🇸 Flags: Bull and Bear
🚩 Pennants: Bull and Bear
☕️ Cup and handle: Standard and inverse
👤 Head and shoulders: Standard and inverse
Between these, pattern spotting 1, and our EMA tutorial you should be able to get some kind of read of pretty much any chart. Think of it as kind of like a check-down: look to find patterns, and if you see nothing look to the support and resistance on the EMAs, and if you see nothing there check your support and resistance horizontal lines.
Here’s a look at the other patterns out there:
🇺🇸/🚩Flags & Pennants: Bull and bear
Flags and pennants are continuation patterns where the price is trending in a direction, has a period of consolidation, and then keeps it moving. They, obviously, look kind of like flags and pennants.

❗️Note: The “pole” leading up to the flag can be straight or a bit slanted. It’s all good.
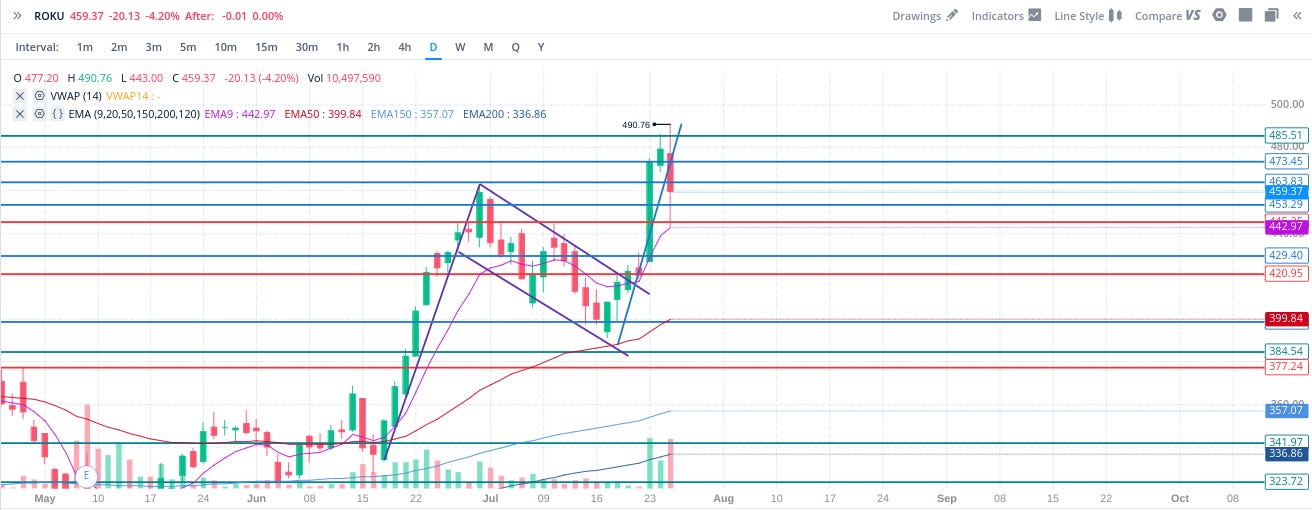
Bull flag example: ROKU
In this, and the future examples, we’ll start with the basic chart without any guidance. We’re looking for a price action running upward (a “pole”), with a 🇺🇸 “flag” headed sideways or down , that would lead into a continuation.
🤷♂️See if you can spot the Bull Flag:

✅ ROKU bull flag with the lines drawn in for indication:
🔍ROKU bull flag with a more detailed diagram:
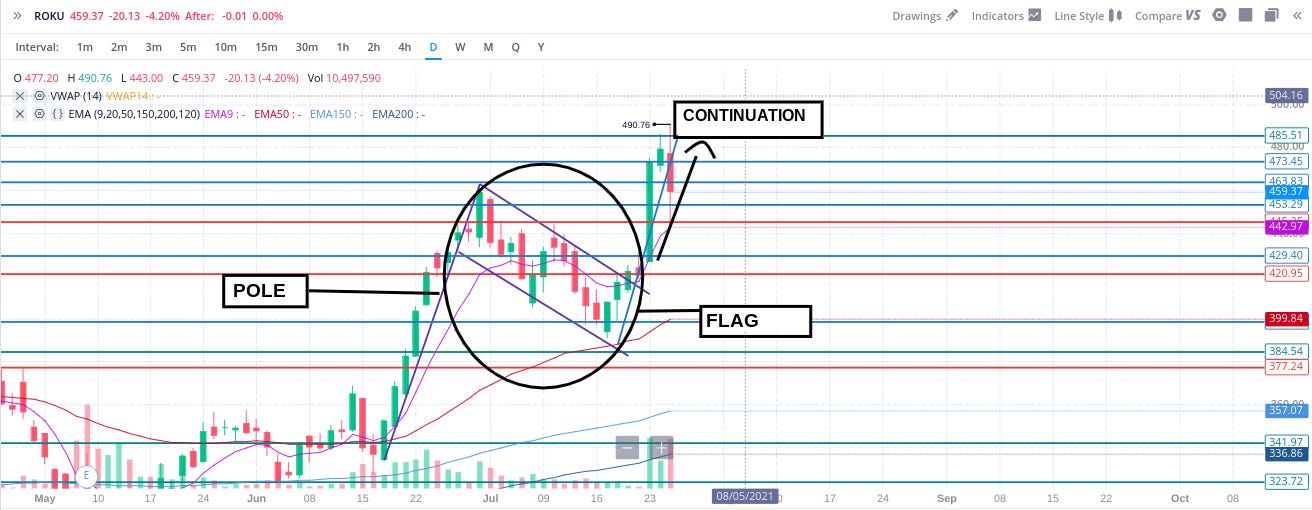
This was a textbook bull flag. I actually saw this flag forming last week, and even called it out on my twitter, then forgot to buy on it. Don’t be me; keep track of your charts.
⭐️ A Bear Flag is the exact same, just inverted.
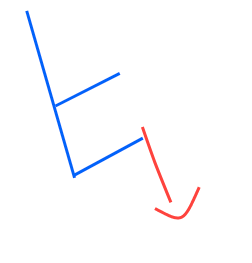
🐻 Bear Flag example: AMC (sorry apes)
Can you spot the bear flag?
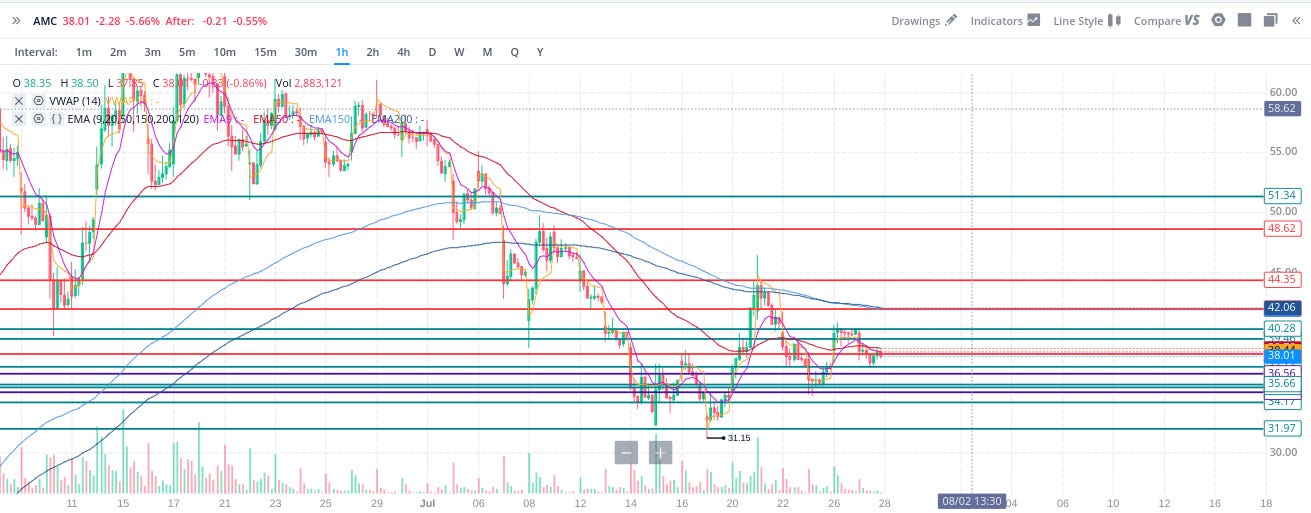
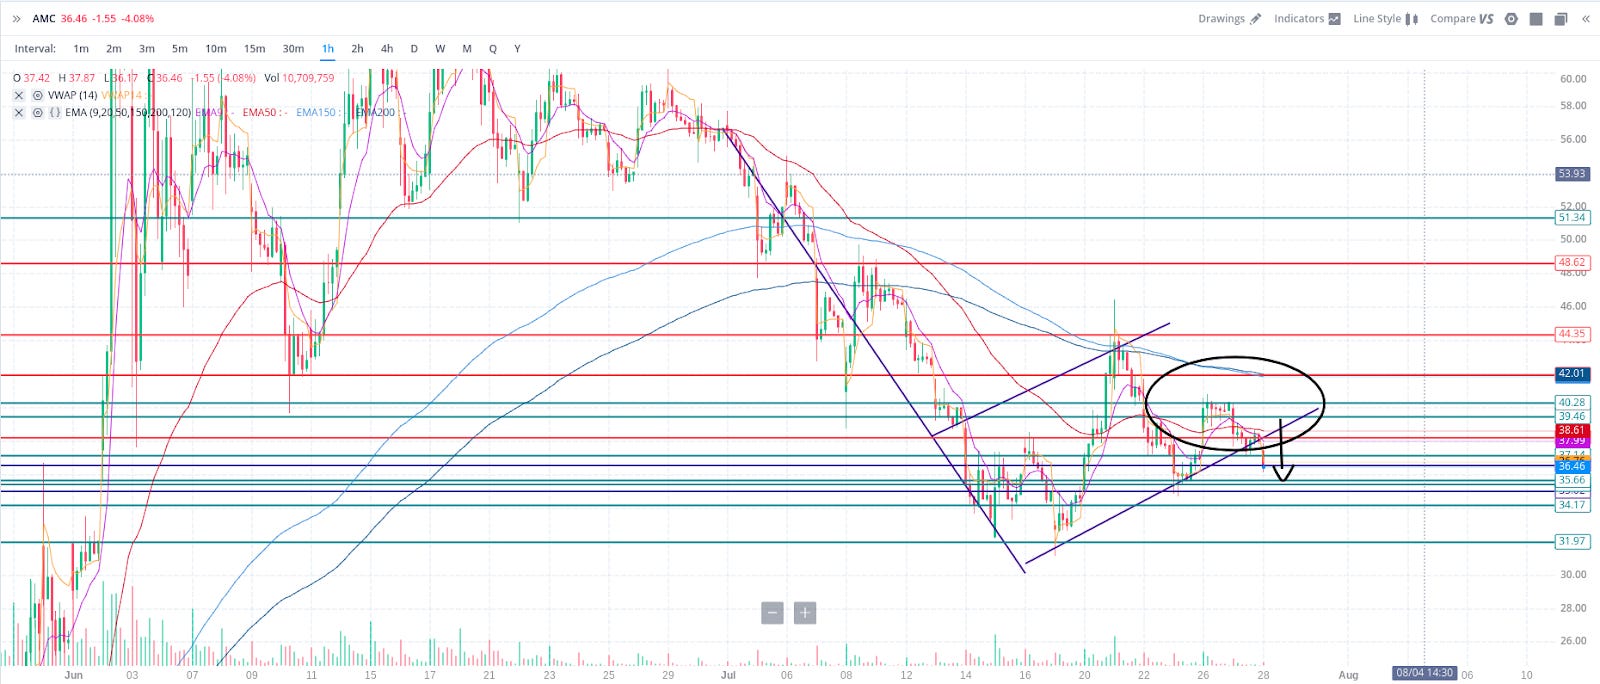
🔍 AMC bear flag diagrammed:
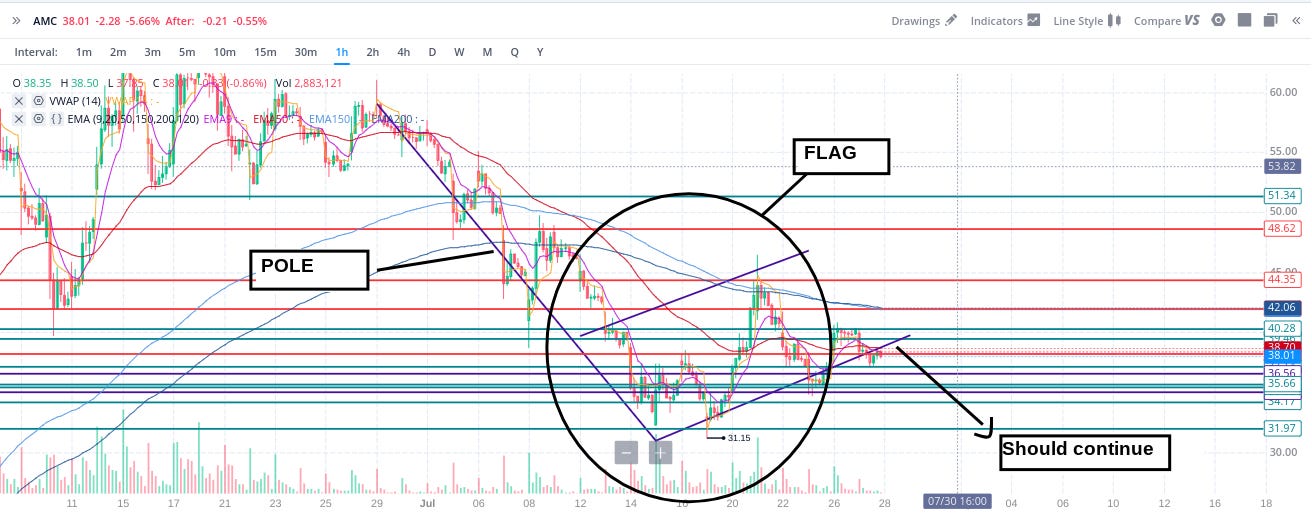
Let’s see if the AMC bear flag started to break downward:
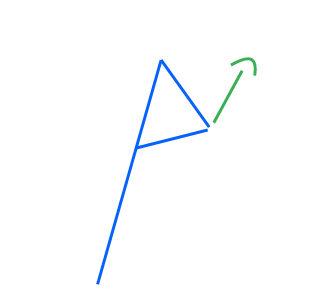
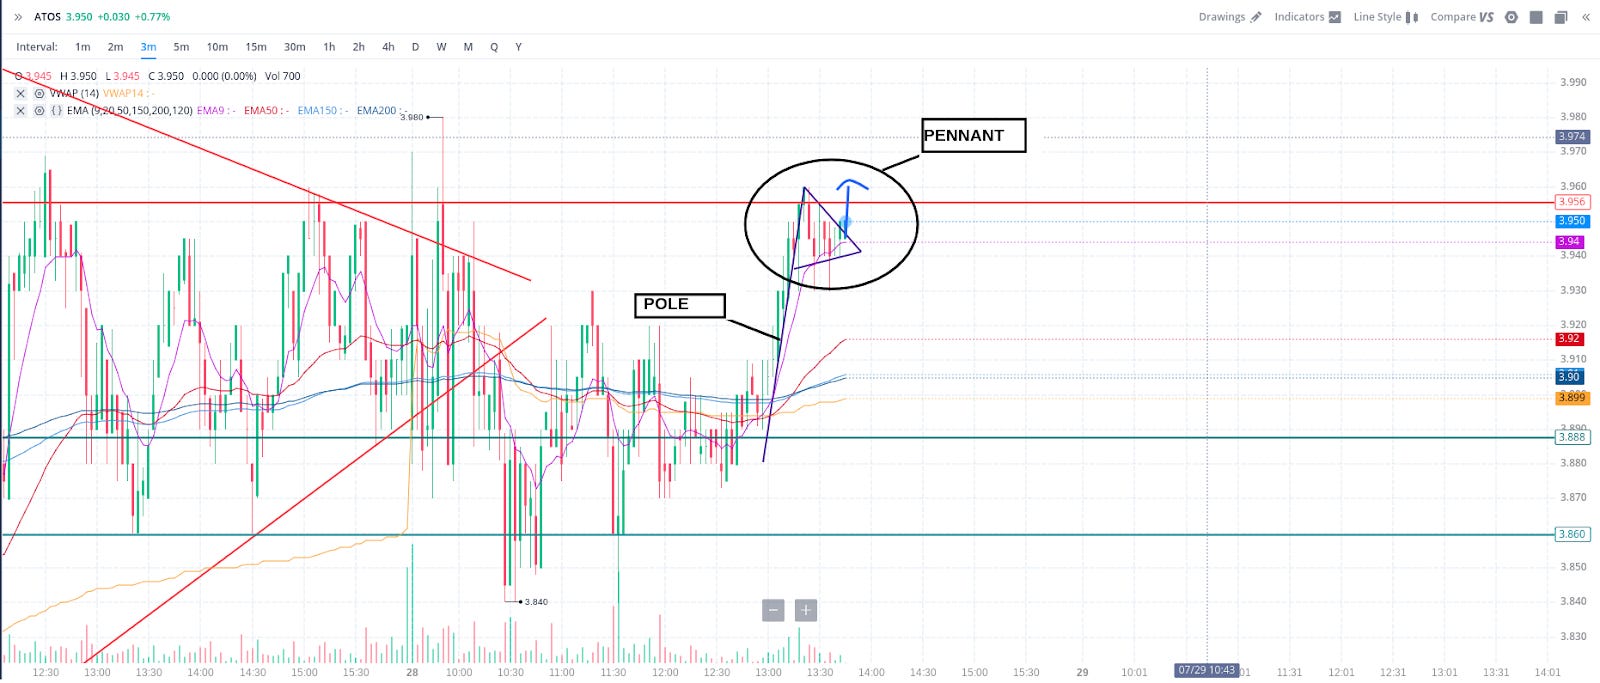
🐂 🚩 Bull Pennant
Happens when there is a strong upward price movement followed by converging price action to an apex before continuing its rocket mission upward.
🐂 Bull Pennant example: ATOS
🤷♂️ See if you can spot the bull pennant:
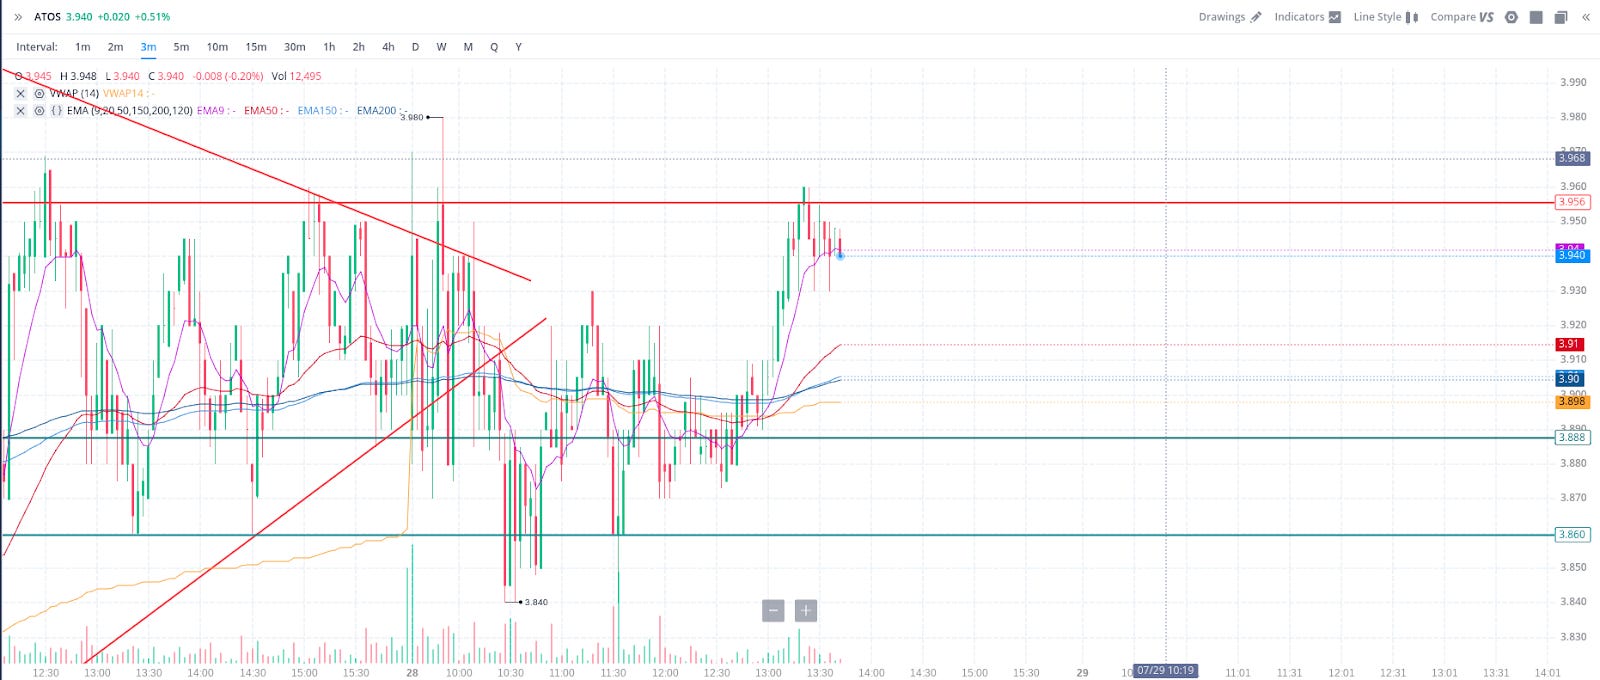
ATOS bull pennant drawn:

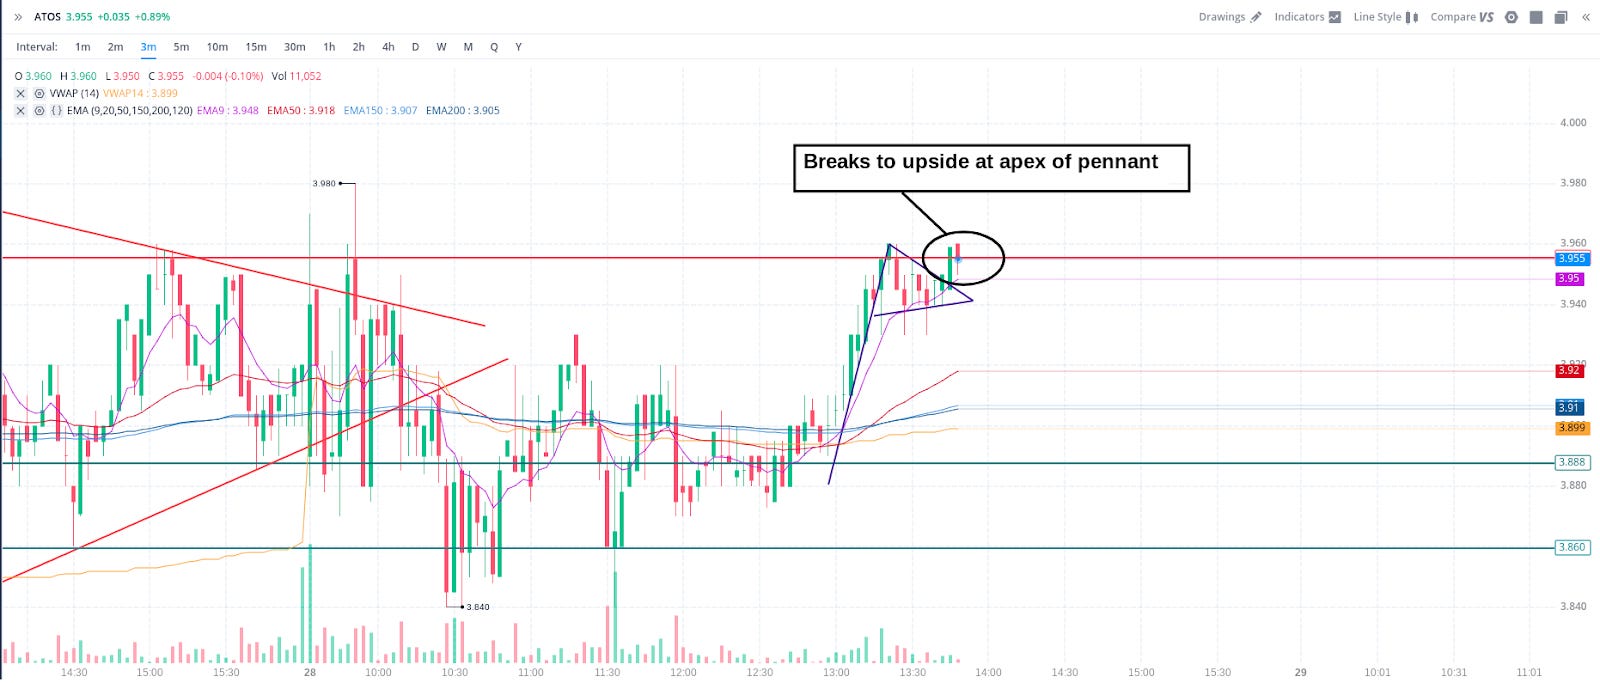
🔍 ATOS bull pennant fully diagrammed:
Let’s see if it breaks upward:
🐻 🚩A Bear Pennant is the same thing just heading downward:
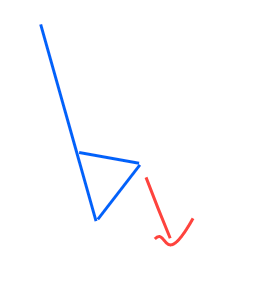
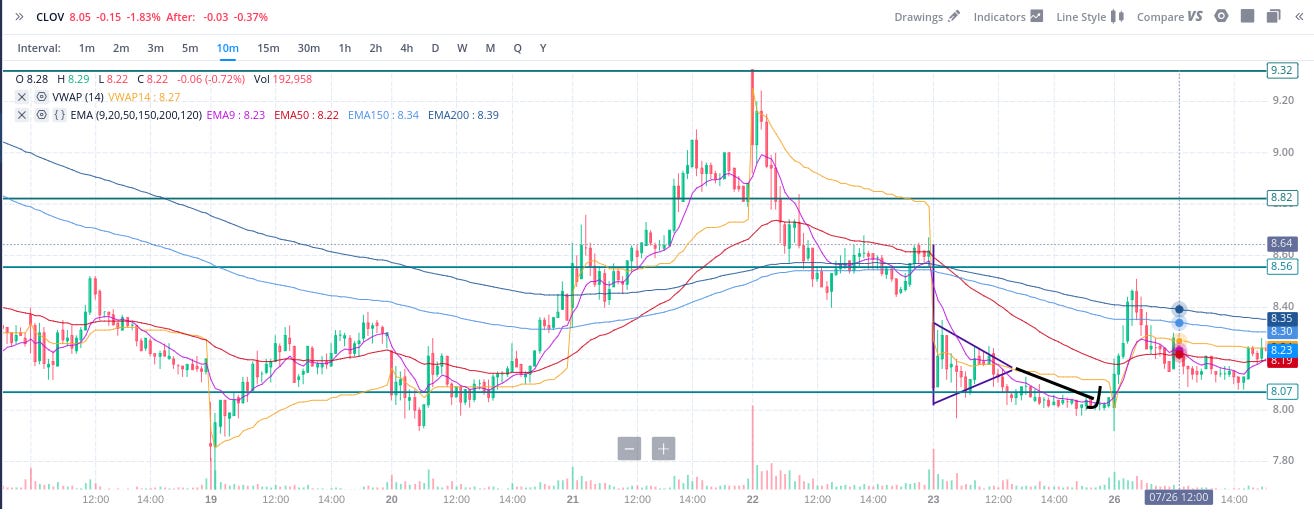
Bear Pennant Example: CLOV
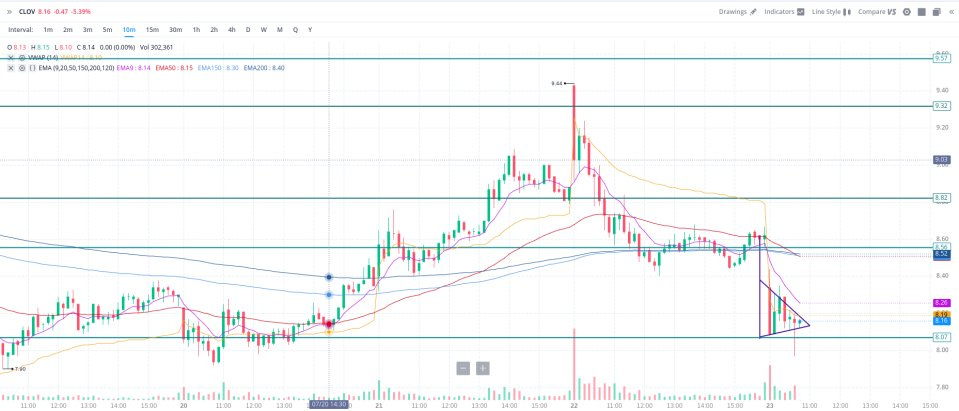
👇The bear pennant breaks downward:
☕️ Cup and Handle
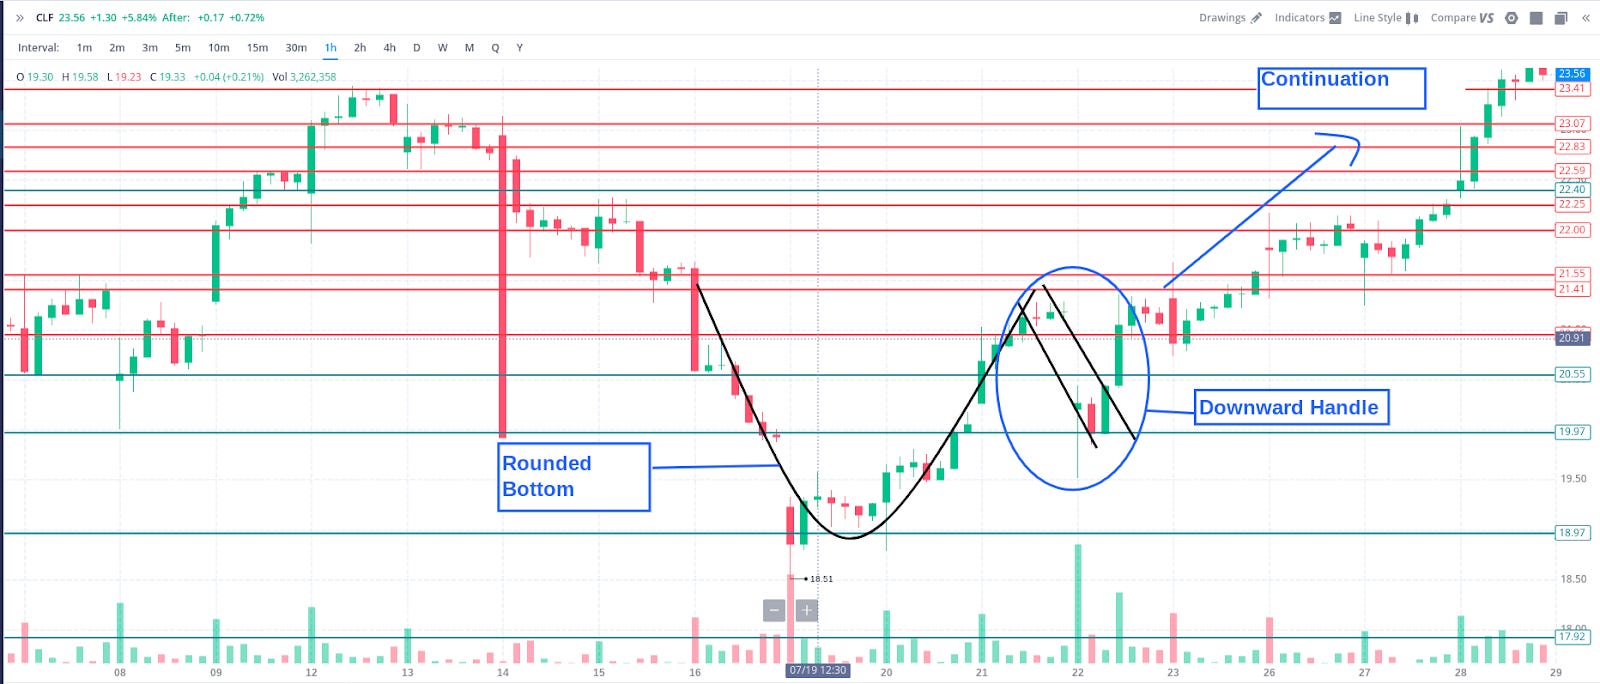
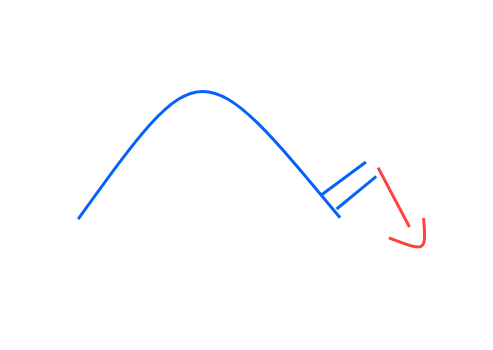
Now you’re onto the big brain shit! Cup and handles see a dip in price, followed by a rise and then a brief consolidation downward before heading upward for about the length of the preceding move. Good way to find it is to first look for the 🍑 round bottom on the chart.

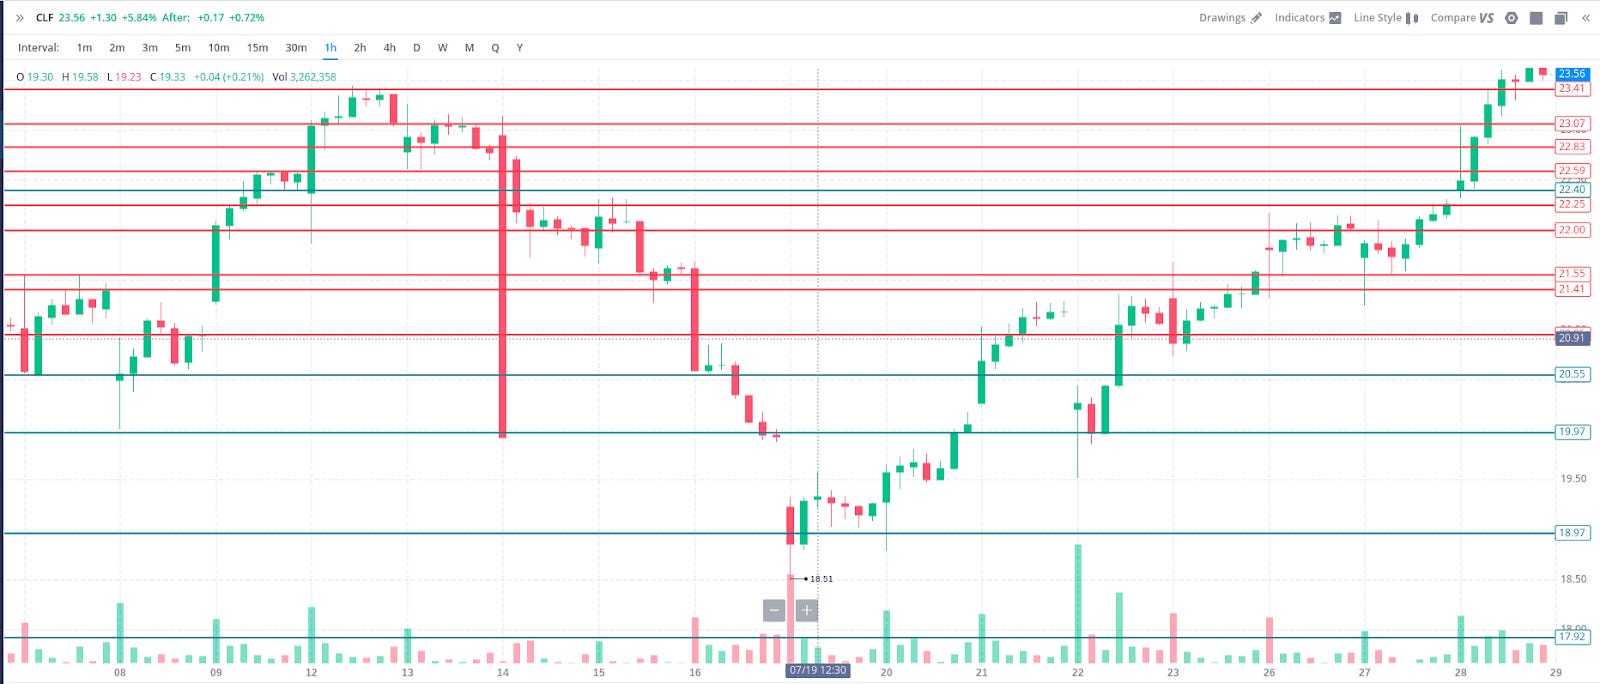
Cup and Handle Example: CLF
🤷♂️Can you spot the cup and handle?
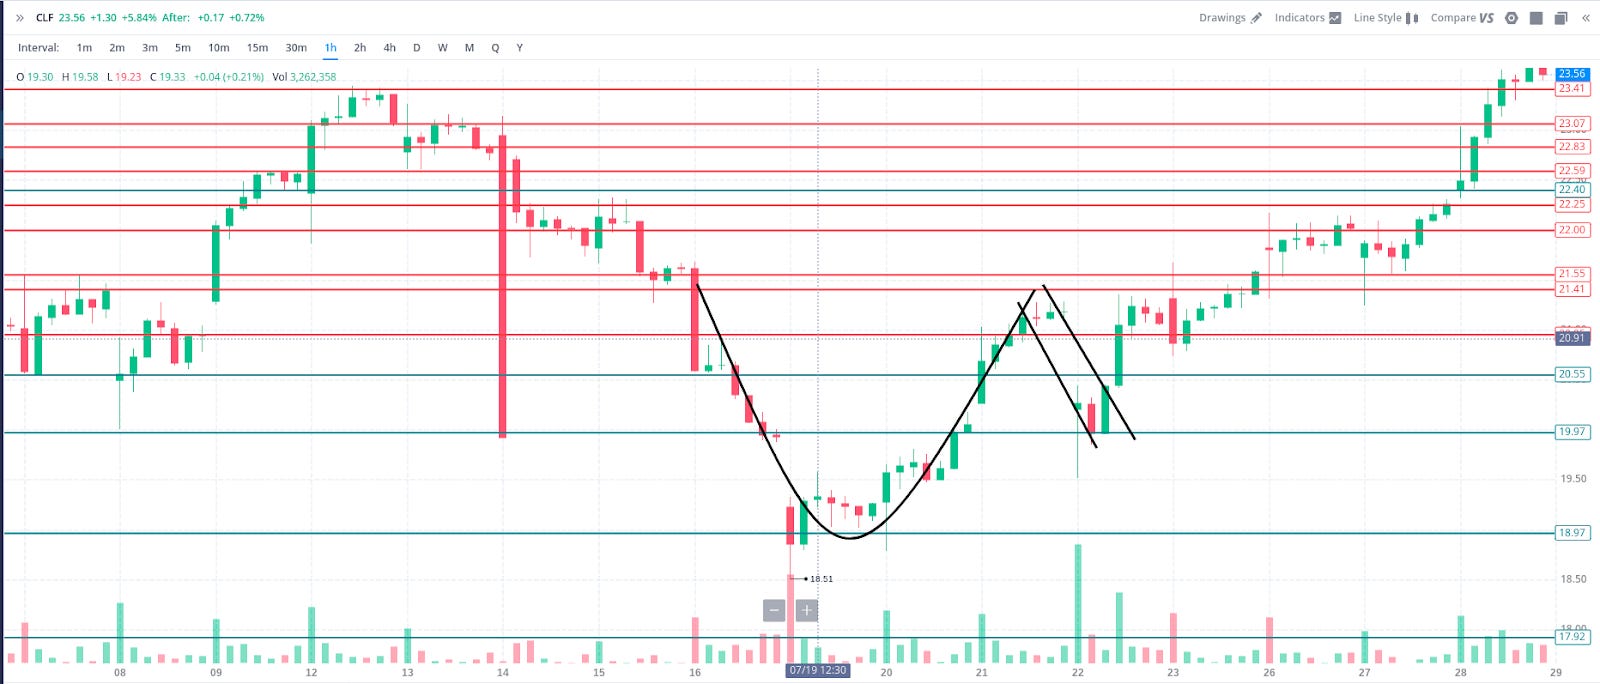
✅ CLF cup and handle drawn:
🔍 CLF cup and handle diagrammed Out:
🙃 ☕️ Inverse Cup and Handle
Same thing, just heading bearish instead of bullish.
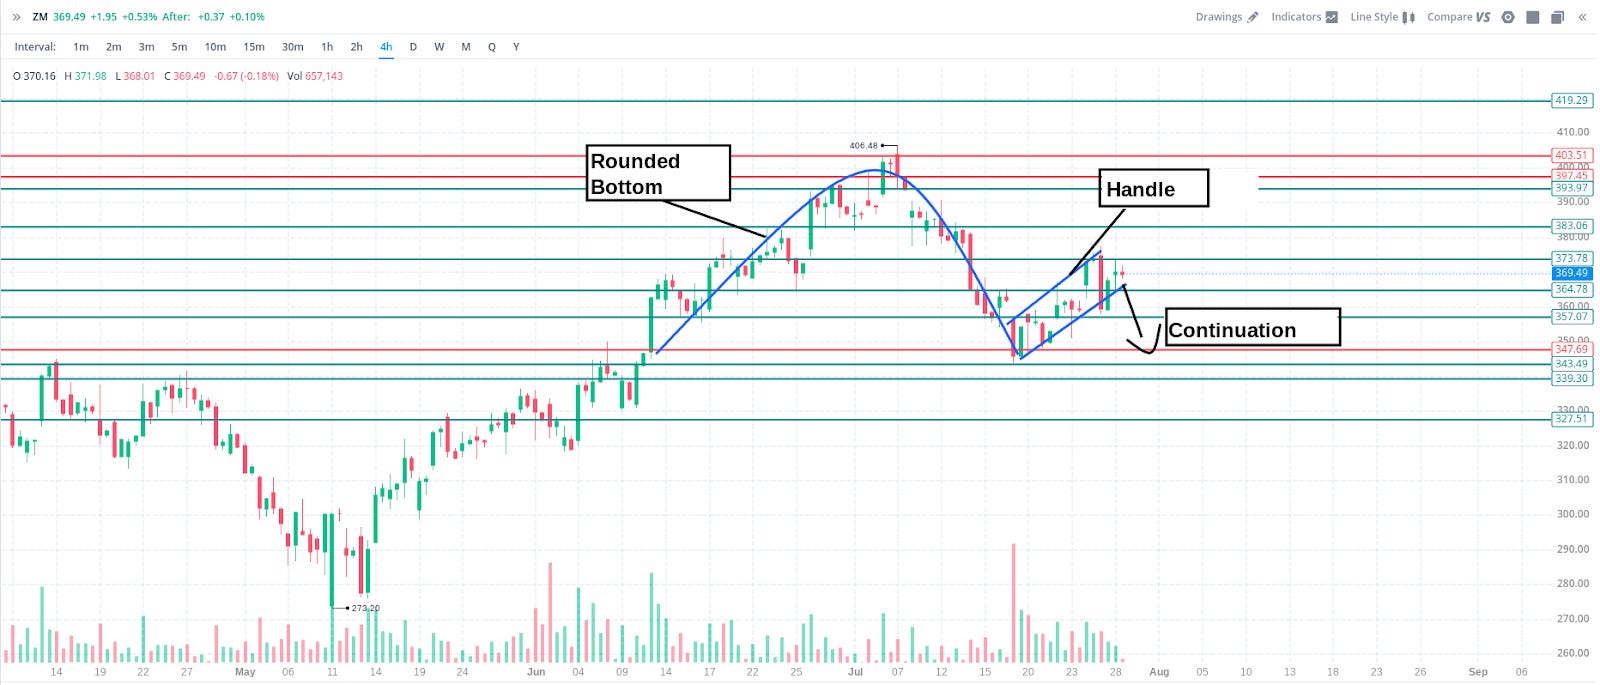
Inverse cup and handle example: ZM
🤷♂️ Can you spot the inverse cup and handle?

✅ ZM Cup and Handle drawn:

🔍 ZM cup and handle diagrammed out:
👤 Head and Shoulders
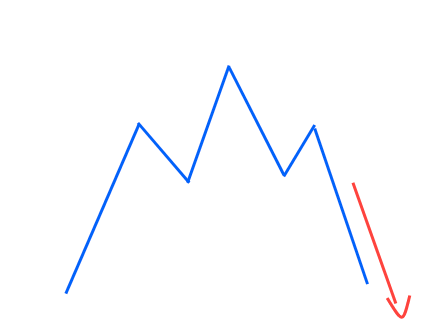
I saved the best for last; everybody and their momma likes to say they can chart once they can spot a head and shoulders pattern. Why? Because the shit is simple. This is a trend reversal pattern characterized by a peak (or shoulder), a larger peak (head), and then another shoulder peak before it shits the bed.
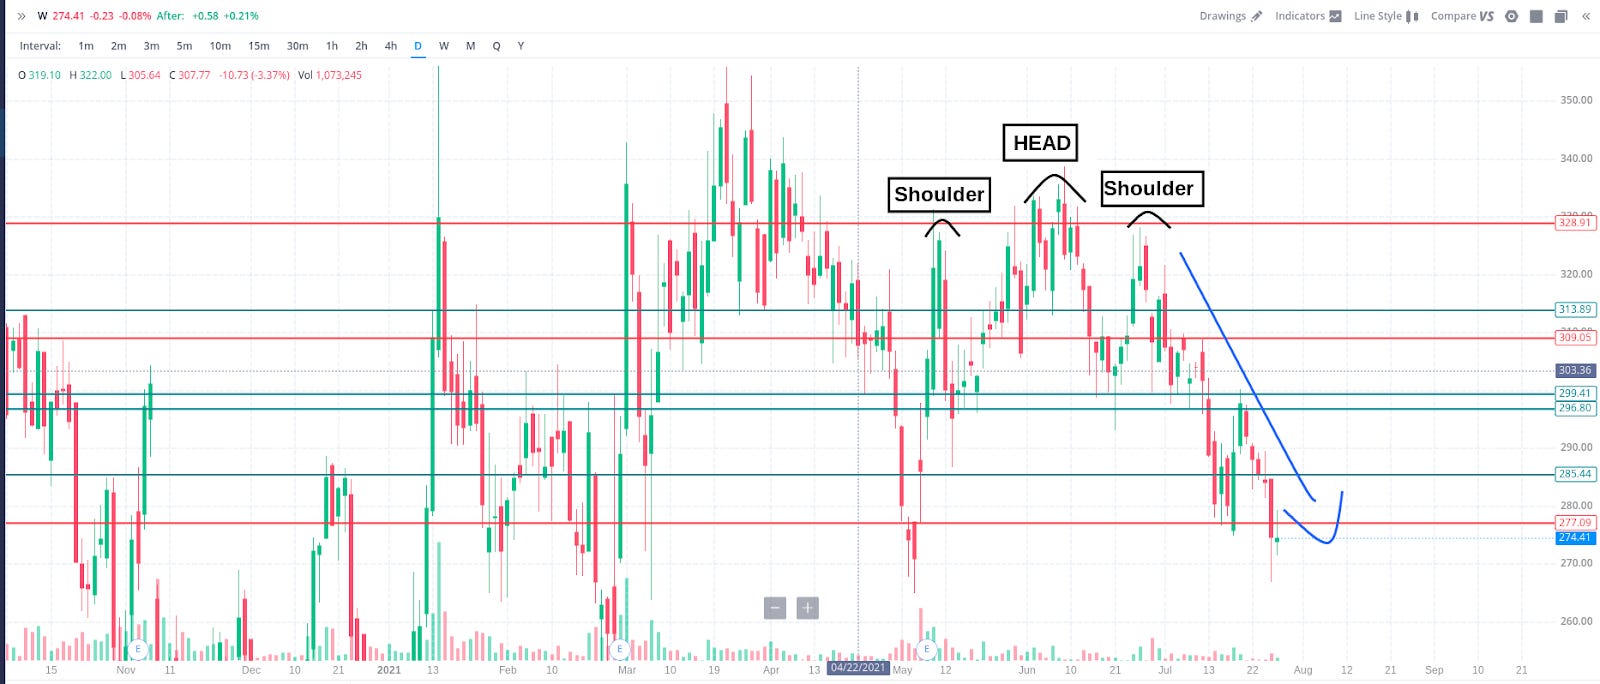
Head and Shoulders Example: W
🤷♂️ Can you spot the head and shoulders pattern?

✅W head and shoulder drawn and diagrammed:
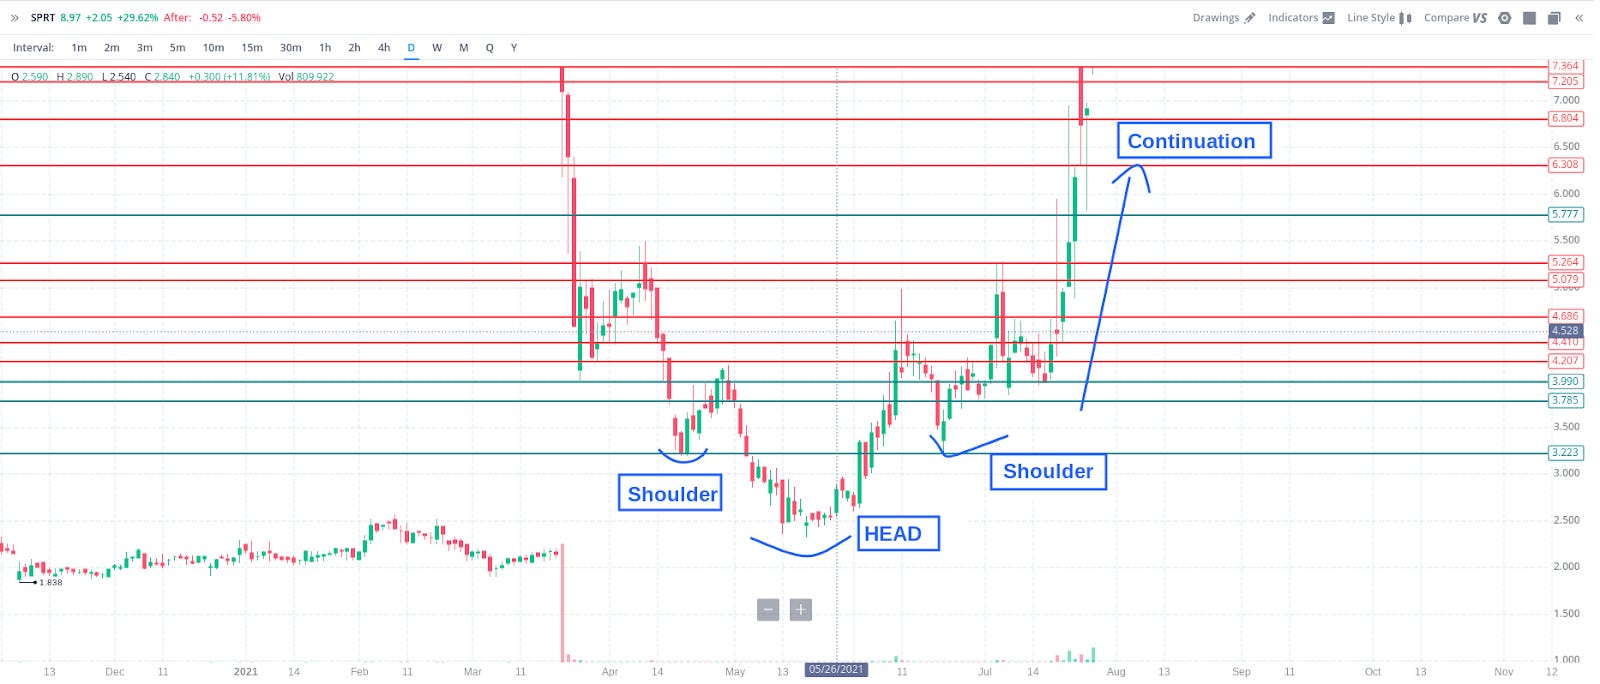
🙃 Inverse Head and Shoulders
Same deal; it’s also a reversal pattern but headed upward this time.

Inverse Head and Shoulders Example: SPRT
😐 Can you spot the inverse head and shoulders?
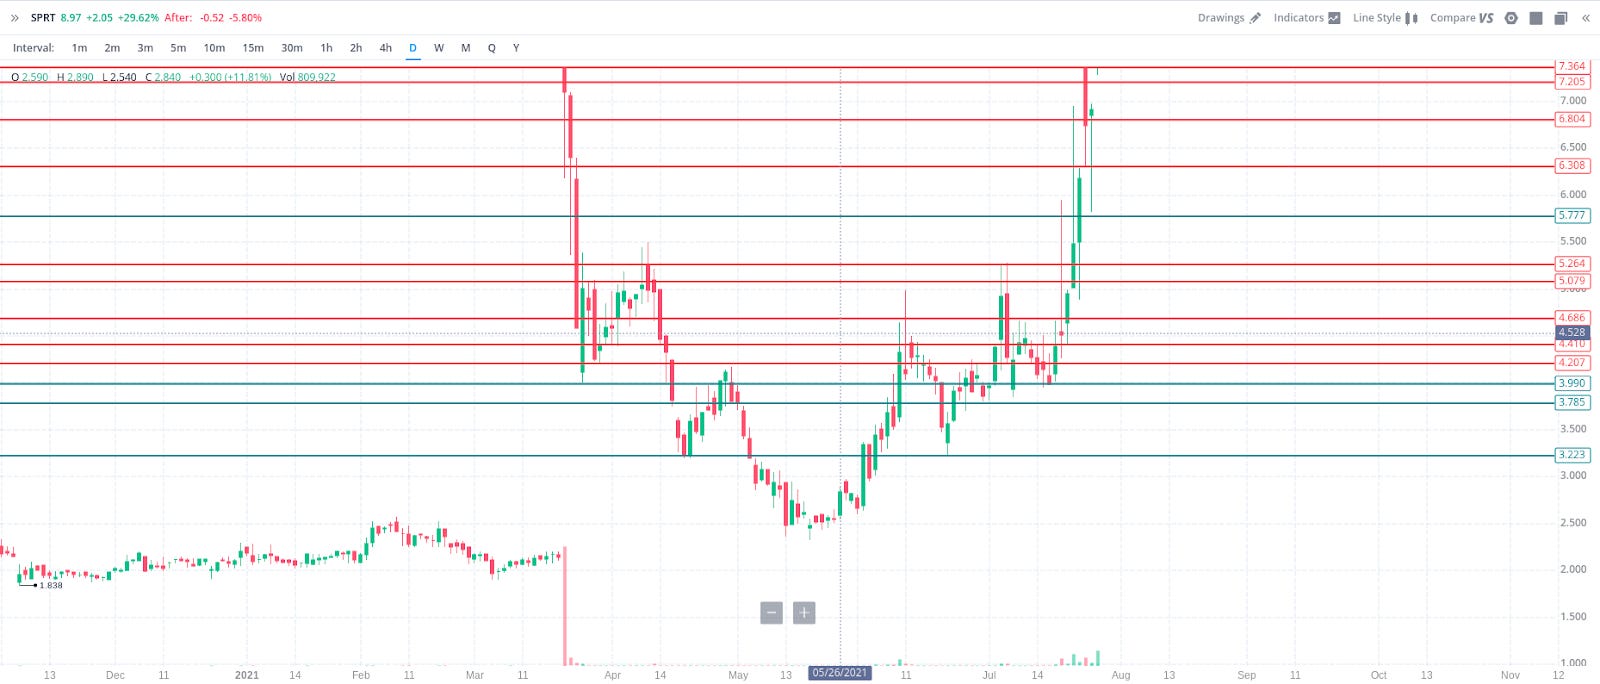
👏 SPRT inverse head and shoulders drawn and diagrammed:
🥳️ Annnnnnd congrats! You now know a whole bunch of patterns! One of the best ways to lose money is to be able to draw while doing it, giving you the reassurance of a false sense of control! Although these generally do work, like all patterns, a lot of times they don’t. ❗️Be sure to set stops and know when it’s just not panning out.
See you for next week’s 🦇 Build-A-Trader! It will be on….well, I dunno yet lol. But it’ll happen!
🪶Pt. 4: Stay Out the $Hood?
A Robin Hood post-IPO Deep Dive
Contributor: @mkt_sentiment
Editor’s Note from @yourboymilt: Whatsup guys! We have a second guest in the house, YEET contributor Market Sentiment, so buckle your seatbelts and sit at attention! Yes, retail has been downright gleeful ever since a giant doo-doo got dumped on Vlad Tenev’s head during the $HOOD IPO Thursday. But, with Robin Hood creeping back for green on day 2, it’s very important to get a no nonsense deep dive.
That’s what Market Sentiment does best! He has killer articles like this each week, and you’d be straight silly not to subscribe to his newsletter. This is the primo, A-1, Grade A DD with numbers and charts—be prepared to actually learn. Without further ado, here’s a $HOOD deep dive:
Hey everyone, it’s me Market Sentiment. I track and conduct due diligence on rapidly growing stocks and do a comprehensive deep dive on one investment strategy/topic every week.
To receive Market Sentiment’s newsletter in your inbox weekly, consider subscribing.

Let’s just say that Robinhood has seen better days. A vast majority of us absolutely hate Robinhood right now. I feel that it’s justified given the blatant disregard they had for retail investors during the GME saga. Adding to this, most of their revenue is driven by the extremely controversial Payment for Order Flow (PFOF) which is currently in the focus of SEC.
But rational investors do not reject a company completely based on how they feel about the company’s business practices. In an ideal world, capital allocation happens based on alignment with the mission statement and practices of the company, but there’s more than one way to make a profit in the market.
There are plenty of examples of companies doing extremely well even though they have been in the continuous focus of public ire and legal issues (Think Nestle with their dubious practices, BAC after the Occupy Wall-Street movement, EA with their micro-transactions, and Amazon with worker abuse).
And for all the hate Robinhood gets and posts about moving out of Robinhood, just sort the gain/loss/yolo posts for the last month in any investing subreddit and you can still see a significant chunk of trades being made through Robinhood.
You can choose to not use their product, but it’s not financially prudent to reject an investment opportunity without due diligence. All the DDs that I have seen exclusively focus on the negative aspects and then reject the IPO, and I think that’s unfair. Especially given that over the past 20 years, ~69% of IPO’s have gained value on listing day with an average increase of 12%. That’s a 12% average gain in just one day!
Basically, what I wanted to know was this – Is Robinhood IPO a good investment opportunity?
So, strap in while I try to condense 300+ pages of Robinhood S1 and my own views into a 5-minute read on The Good, The Bad, and The Ugly of Robinhood.
The Beginnings
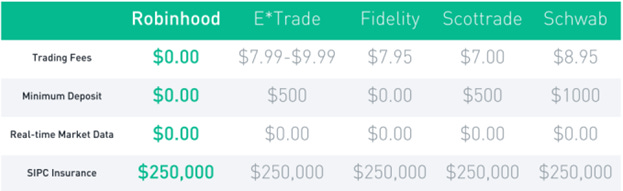
Robinhood had a spectacular launch by any metric. They had amassed nearly 1 million users before the company even existed by gamifying their beta program. Their promise was very simple. $0 transaction fees for all the trades.
From the very beginning, Robinhood had planned to create revenue from
a. Premium API access
b. Trading on margin
c. Interest from holding custody of user’s assets
d. Payment for order flow
The Good
Growth:
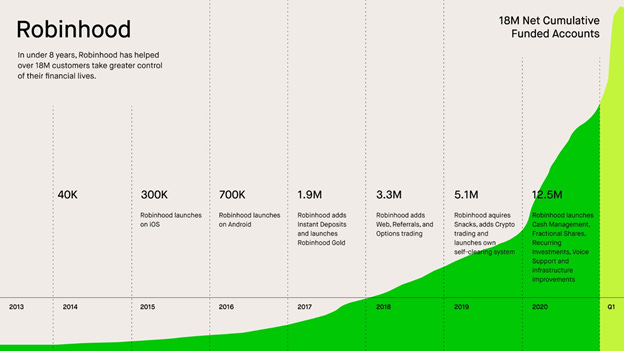
The company has grown exponentially over the years (even before the meme stock frenzy) with them approximately doubling the funded user base every year. The current retail frenzy only pushed up this growth rate. Adding to this, 80% of the users who joined them in 2020 were through word-of-mouth and Robinhood Referral which enabled them to grow organically. We don’t have enough data to tell how this has changed following the GME scandal, but the one thing we can be sure of is that people are definitely still talking about them. The revenue has also followed suit growing by 309% for the year ended Q1’21.
Profitability [1]:

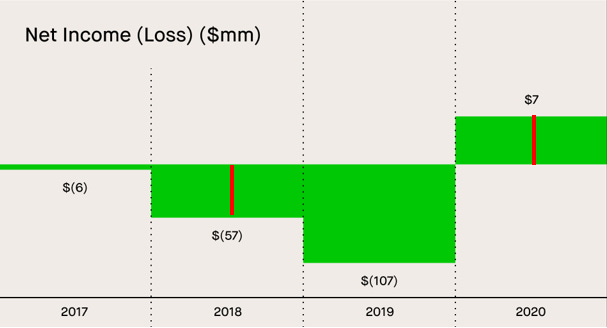
It’s highly unlikely for a company that is growing almost 100% every year to be profitable, especially in the tech world. But Robinhood was briefly profitable in 2020 before having a $1.4B net loss in Q1’21 due in part to a $1.5B fair-value adjustment to convertible notes and warrant liability.
Product:
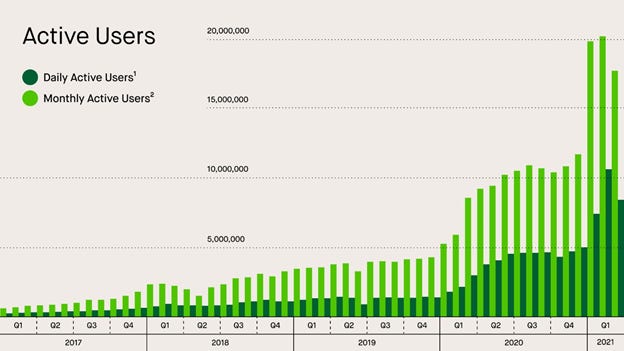
It’s undeniable that they have a very well-designed product suite. It makes it very easy for first-time investors to invest in stocks (this is also reflected in their user base with more than 50% of them being first-time investors). The Robinhood gold monthly subscription program currently has more than 1.4 MM customers. Adding to this, their crypto, cash management, and educational solution combine to create a well-suited ecosystem for first-time investors. The stickiness of the product can easily be seen in the monthly active user numbers.
The Bad
Revenue Stability
Robinhood’s income is highly dependent on retail investors getting into the riskiest investments – Options, Cryptos and Margin. This would be extremely dependent on a highly volatile market that we saw over the past year. Once/if this settles down, the revenue stream is bound to reduce. This in itself would generate a conflict of interest with Robinhood actively encouraging this risk-taking in the user interface, through dark patterns and gamifying the experience.
Competition
Almost all the major competitors who used to charge a per transaction trading fee have now cut down their commission to zero. While this might not be the only USP of Robinhood, for a new investor coming into the trading ecosystem, Robinhood is not a compelling choice given the controversies surrounding them. The only thing they have going for them with regards to competition is an exceptional user interface, which again is subjective to the user.
Valuation
According to the updated prospectus, Robinhood is aiming for an initial price target of $38-42 a share, which would value the firm at $27-35 Billion. The company expects to raise around $2.2 Billion from this IPO. While a high valuation is not unlikely for a tech company, $HOOD is potentially valued now at 37x historical FY 2020 Price-to-Sales or P/S. This, when compared to Charles Schwab (10.8x) and Tiger brokers (20.1x) is on the higher side. Most probably the justification for such a high valuation is their current trajectory of customer growth and the average age of the customer (younger customers tend to be more valuable over the long run).
The Ugly
Payment For Order Flow (PFOF) and Regulatory Risks [2]
Ahh, finally we come to the most controversial part of Robinhood. The irony here is that PFOF was invented by Bernie Madoff. If you want a detailed understanding of PFOF, you can read it here or here. The TLDR version is
A broker takes your market buy order for 100 shares of Acme, Inc., aggregates it with all the other small Acme buy orders, and sells that to a market maker, who fills the order. The market maker pays your broker for the volume
The spread between the buy and sell orders are then shared by the market maker (in Robinhood’s case Citadel) and the Brokerage (Robinhood).

Almost all the major players (except Fidelity) have some amount of revenue coming in from PFOF and this is not necessarily a bad thing. From my understanding, this actually benefits the retail investor by moving the cost of the transaction from the user to the market maker.
But the main concern for Robinhood here is the amount of revenue they are generating from PFOF.
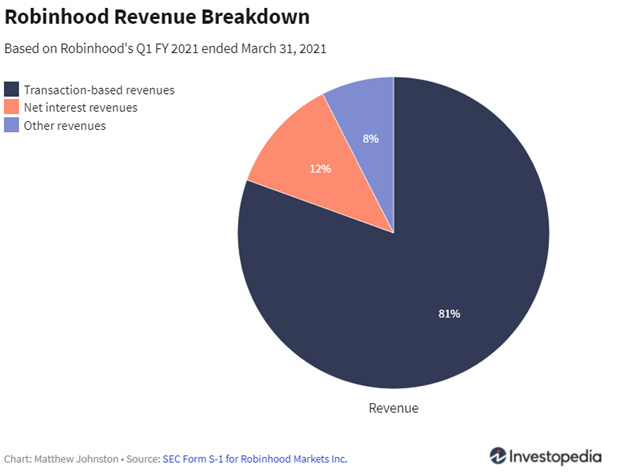
For Q1’21, 81% of the company’s revenue came from transaction-based revenue (PFOF). In contrast, PFOF contributes less than 20% for TD Ameritrade and Charles Schwab. Adding to the high risk of having more than 80% of revenue from one source, Robinhood has been repeatedly fined for not having the customer’s best interest in mind.
· FINRA fined HOOD $1.25M in 2019 for not getting customers the best prices
· FINRA announced that Robinhood would pay a record $70M in fines and restitution over the outages and Robinhood agreed to the settlement.
· They are facing more than 90 lawsuits after the GameStop trading halt
· Finally, SEC chairman Gary Gensler has said that not every country allows PFOF and they are going to take a closer look into PFOF.
Conclusion
Robinhood started off with an extremely promising idea and then dropped the ball at its most important moment. Undoubtedly, they are going to report a blowout Q2 earnings report shortly following the listing and the stock is going to pump (They would have made a killing with the Dogecoin rally in April and May and other meme stock rallies such as AMC/CLOV in Q2’21).
Another interesting insight that we could make from their Q2 report when it’s announced is if they had any net user attrition following the scandal. The age-old saying of “any publicity is good publicity “ would be put to test! If they still maintained their growth story with AUM and active user base increasing consistently, that would be impressive, and we would know that the investor sentiment that we are seeing now is not actually translating to lost business.
We might need to re-evaluate this analysis once the IPO is over and they have announced their Q2 report and the market has settled down. But right now, given that we have an overall picture of the company and how they make money, I feel that the risk factors far outweigh any potential listing gains that you could make!
Footnotes
[1] It’s extremely hard to be objective when the company keeps on trying to pull one over you. The following chart is from Robinhood’s official filing to SEC. They have shown +7MM and -57MM net income as the same size (that red line is the same length in both). Note that the losses are also shown in green and the scale is completely off. The actual scale can be found in the post.
[2] Fun fact: The risk factor section in the S1-Filing is 75 pages long and over 52,000 words. No wonder their Chief Legal Officer Daniel Gallagher (Ex-SEC Commissioner) got that $30 million bonus.
If you found this post valuable, check out some of my other posts:
As always, please note that I am not a financial advisor. Hope you enjoyed this week’s analysis.
👀 Pt. 5: The Whale Watchlist Picks
Made possible with help from the @unusualwhales Alerts and Flow Tool. Sign up here!
Contributors/Tipsters:
Discorders: Account Blow Up and The Resident Discord Elon Stan
Tweeters: @chillyyyyyyyyyy @dudue180 @deadeyerolf @namit_roy
Whale WatchList:
📞Calls: ⭐️PTON, TSLA, SBUX, TLRY, PINS, FSLR
👿Puts: None bear r fuk
🎲 E.R. Gamble: DKNG
🚀Meme of the Week: SOFI
🍌 Meme Reads: AMC, GME, BB, EXPR, CLOV
🕊 Pour one out for the homie: ATOS
⭐️ = Milt’s Pick
1. ⭐️ PTON Calls (5k+)
Fairly simple to me. Great read metrics, and when all the gyms close again Becky will pedal my calls to the moon. I’m loving this play, plain and simple.
🐳 PTON: Unusual Whales Alert
none
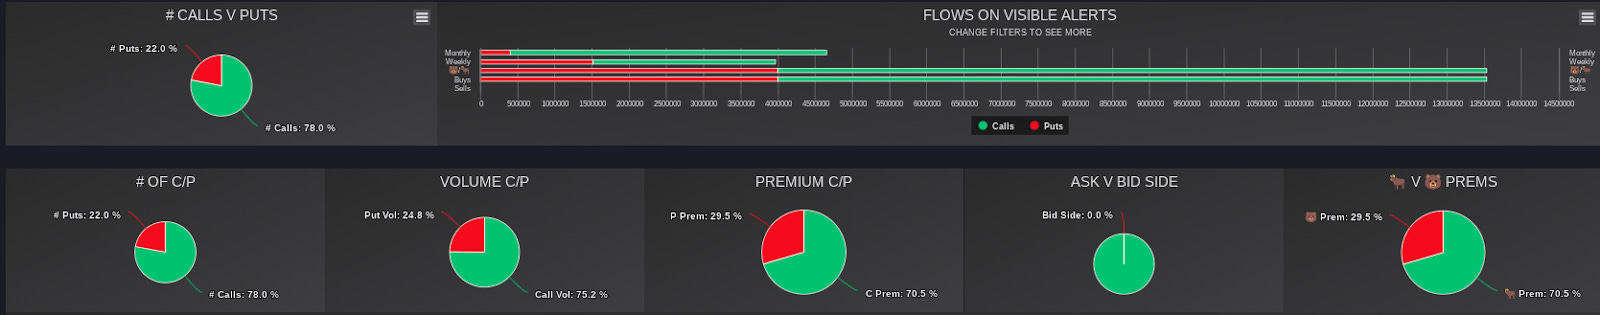
🌊 PTON: Flow reading

📈 PTON: Flow Chart
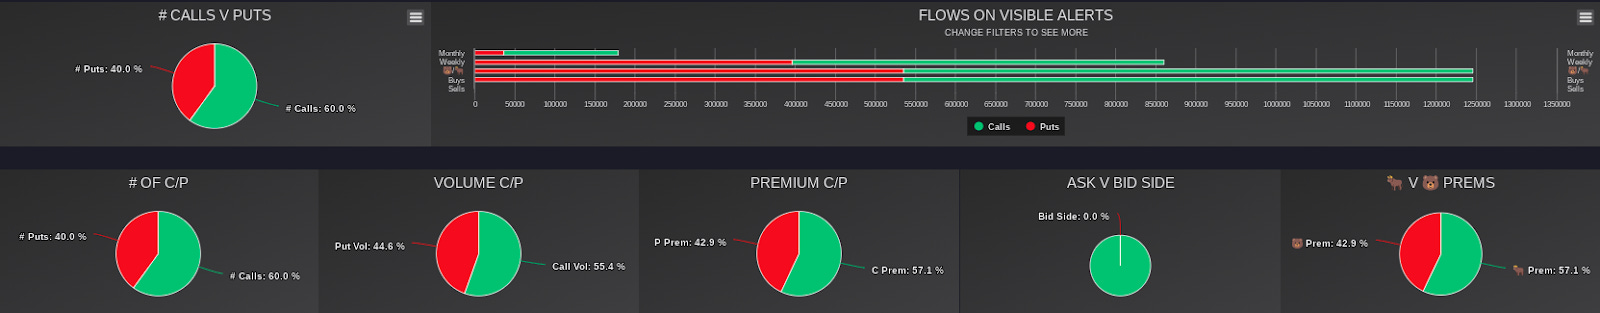
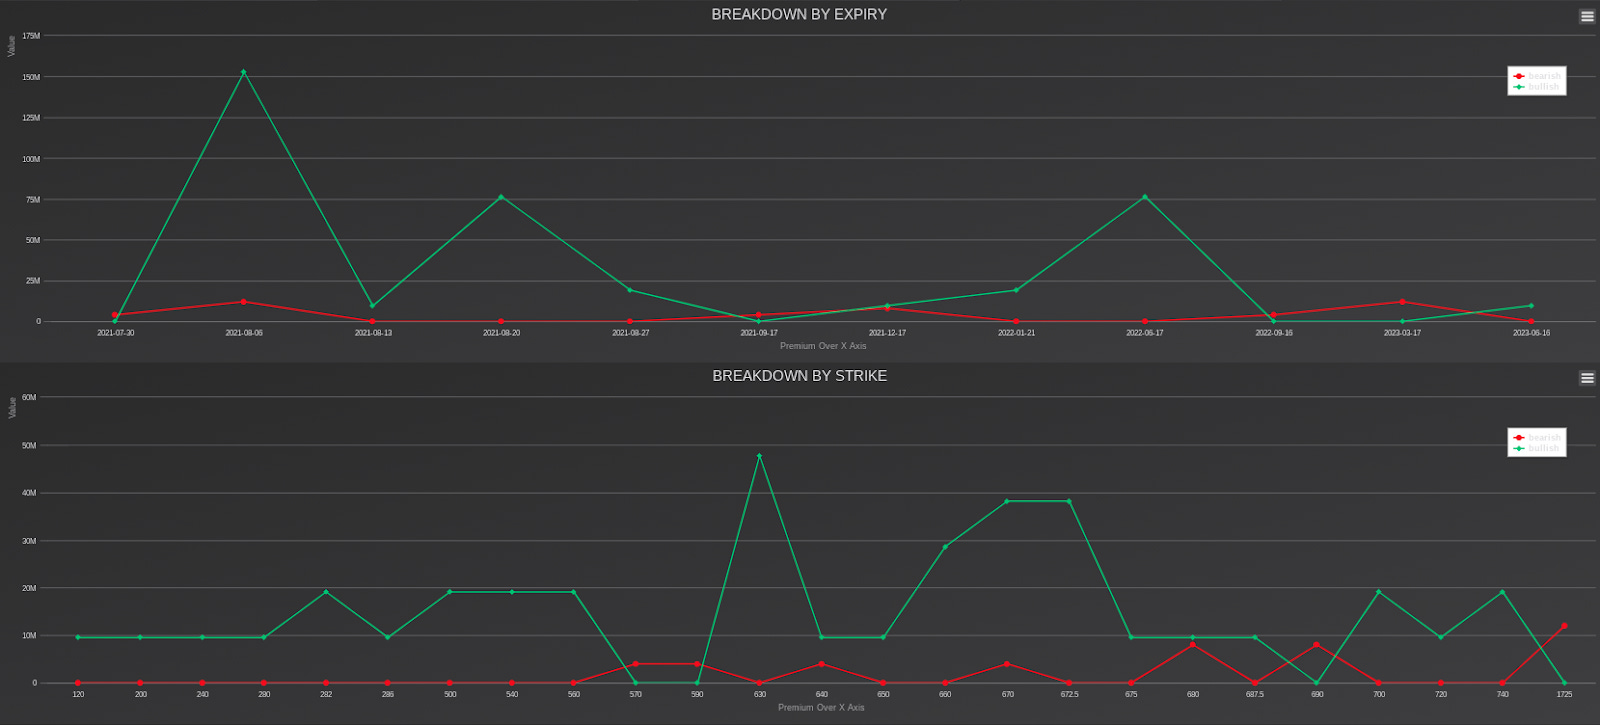
⌚️ PTON: Expirations and Strike
Expiry: 8/6 and 10/15 has bullish spikes. Decently bearish spikes for 8/20 and 9/17.
Strike: 120, 125, and the 140 all saw bullish action. Bearish action on the 110.

📊 PTON Chart:
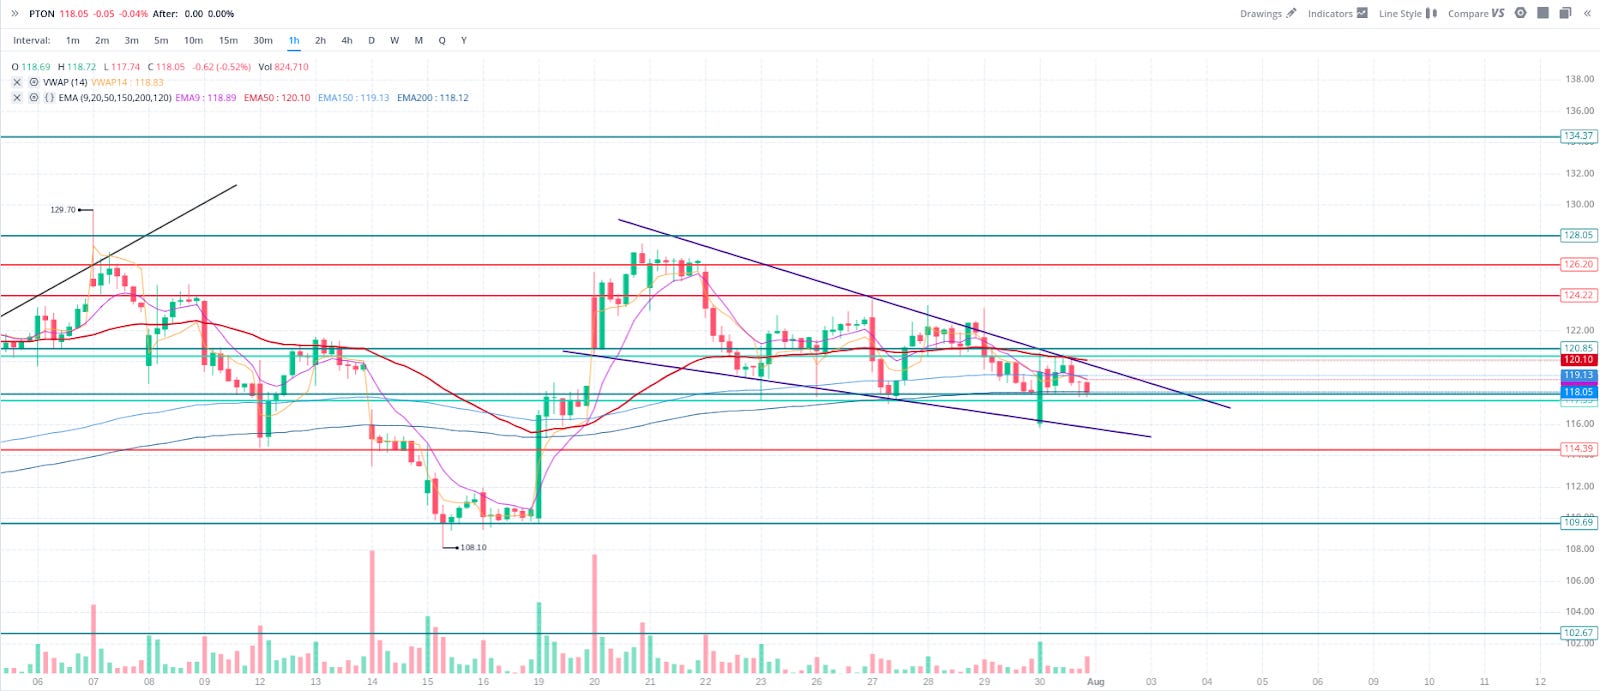
📝 PTON: Levels
Upside: 120.45, 120.45, 125, 126.20, 128.05
Downside: 117.50, 114.40, 109.70, 102.67
2. TSLA Calls (100k+)
Tipsters @dudue180 @spactastical @chillyyyyyyyyyy
With infrastructure including EV’s and the industry recently having hit a lull, TSLA stands to benefit here. I like the chart, and I like the fact that Musk has said he simply isn’t doing routine earnings calls anymore lol.
Elon Provides.
🐳 TSLA: Unusual Whales Alert

🌊 TSLA: Flow reading

📈 TSLA: Flow Chart
📊 TSLA: Expirations and Strike
Expiration: HUGE spike in the 8/6—they want it now.
Strike: The 630 and 672.5 with intense bullish action.
📊TSLA: Chart
Broke out of that bullish descending triangle we spotted on twitter last week

*TSLA 4 hour chart
📝 TSLA: Levels
Upside: 697.25, 716.75, 727, 747.20, 763.6
Downside: 678.15, 674.10, 658.65, 647.15, 634.35
3. SBUX Calls
Becky likes to cool down during the hot summer days with an ice-cold Frappuccino. Definitely oversold off earnings, then caught a stray with a red day across all indexes—I feel pretty strongly they will rebound.
🐳 SBUX: Unusual Whales Alert
none
🌊 SBUX: Flow reading

📈 SBUX: Flow Chart

⌚️ SBUX: Expirations and Strike
Expirations: Bullish spikes spread all across the August expirations and the 1/21/22 LEAPs.
Strikes: Again, spikes all over the place but particularly the OTM 125 strike.
📊 SBUX: Chart
Liking this little wedgie-poo on the hourly (it’s on the 4 hour, too).
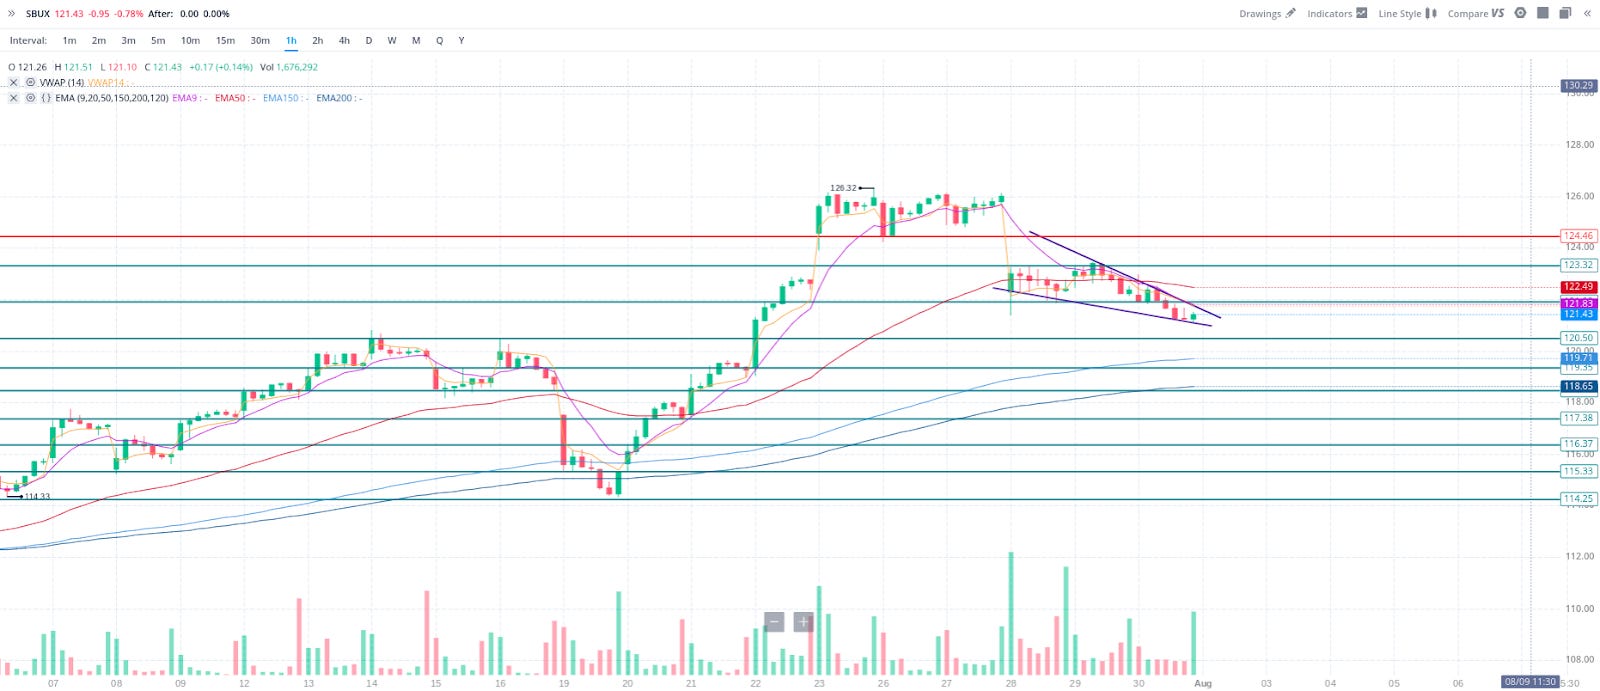
📝 SBUX: Levels
Upside: 121.92, 123.32, 124.45, 126.07
Downside: 120.5, 119.35, 118.50, 117.38, 116.37
4. TLRY Calls
Going up in smoke, baby! Potential gap to fill down to 12.7ish, but fuck that, we fear no bear! But seriously, be careful for the drop but I like the stock, I like their recent earnings, I like their chart, and I like their flow.
🐳 TLRY: Unusual Whales Alert

🌊 TLRY: Flow reading
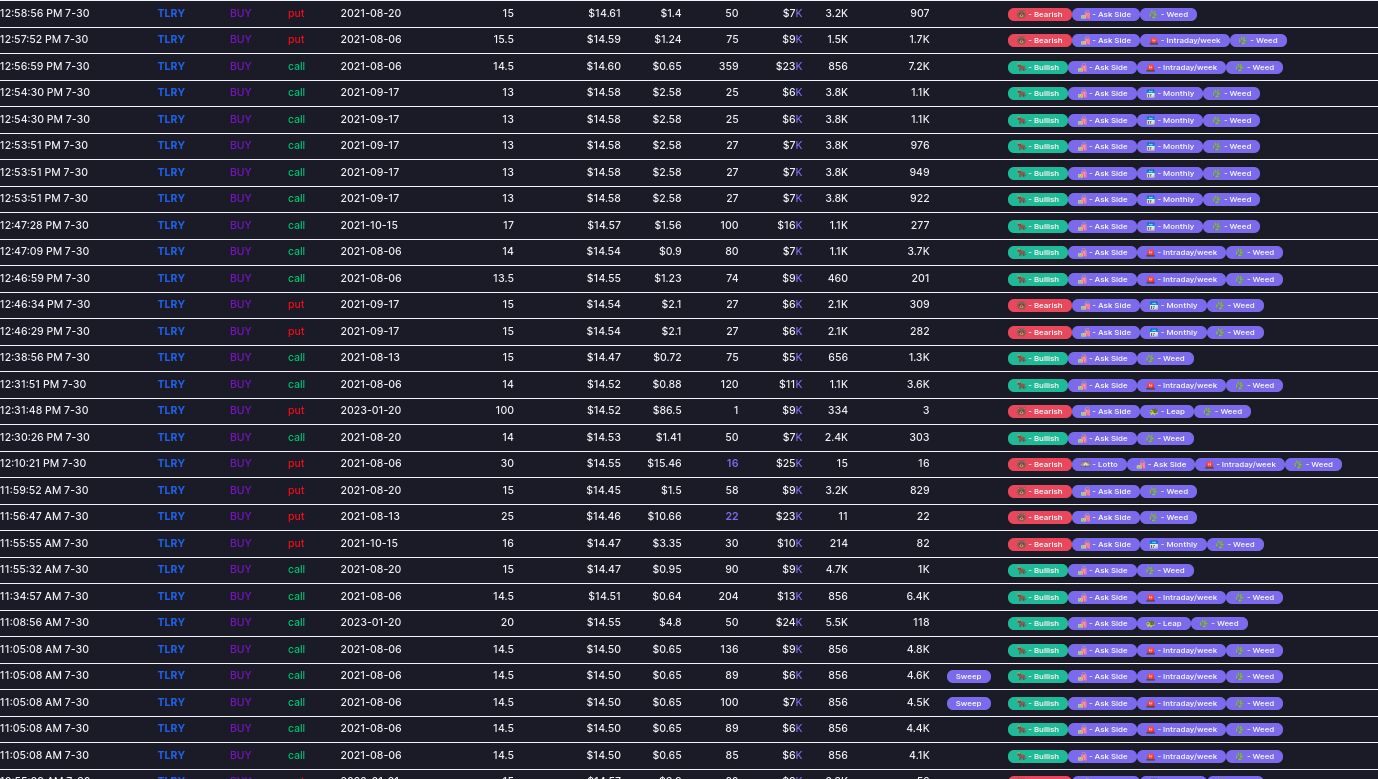
📈 TLRY: Flow Chart

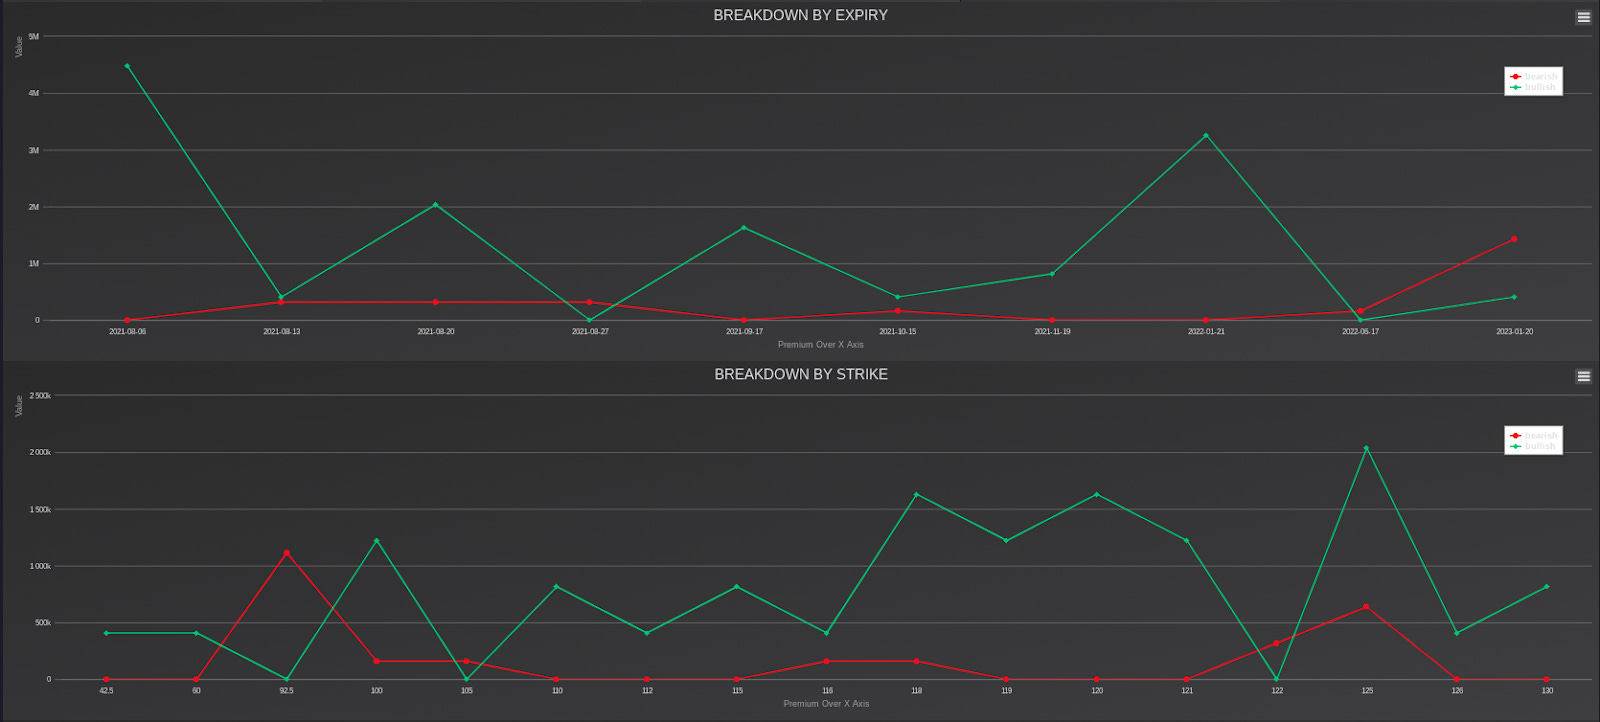
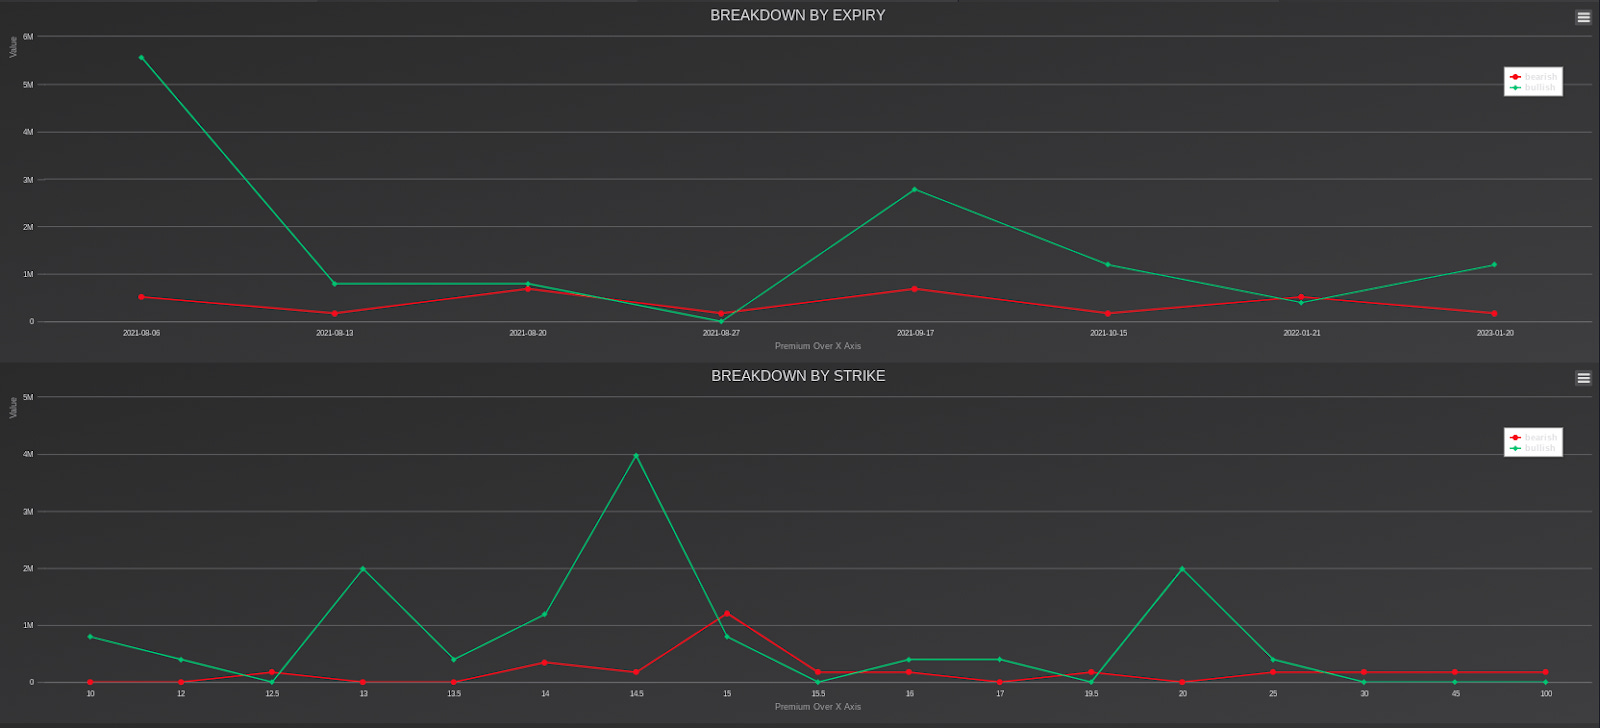
⌚️ TLRY: Expirations and Strike
Expirations: Big bullish spikes for the 8/6 and 9/17.
Strikes: The 14.5 had a big spike in bullish action, followed by the 13 and the 20.
📊 TLRY: Chart

📝 TLRY:Levels
Upside: 15.50, 16.30, 17.04, 18.42
Downside: 13.3, 12.7, 10.74
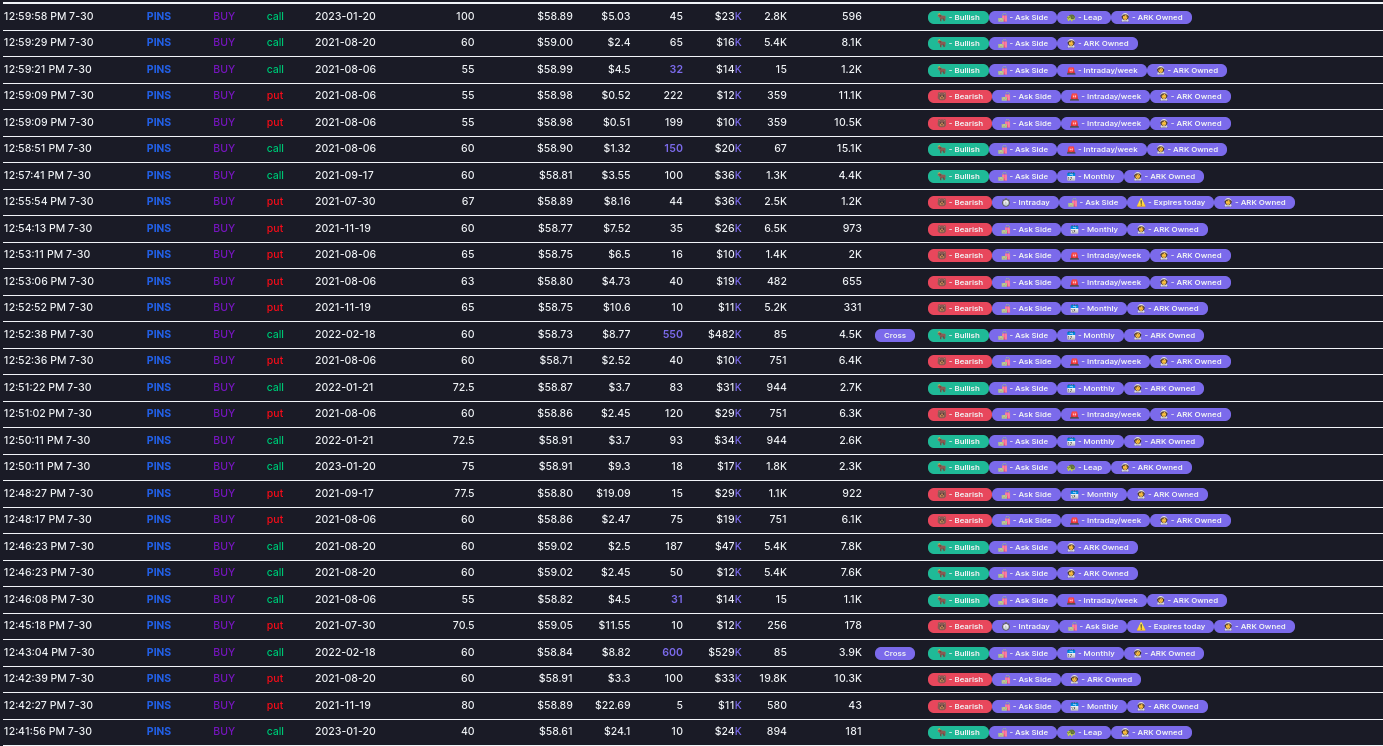
5. PINS Calls (10k+)
Beaten to an absolute bloody pulp after their earnings showed slowing user growth, but that doesn't lead me to doubt Becky. They showed a 125% increase in revenue, indicating the users that didn't flee post-Covid were actually spending more dinero. Look at Friday: they held 58 support all day, had bullish flow, and are looking at a potential Delta boost. Bullish.
🐳 PINS: Unusual Whales Alert

🌊 PINS: Flow reading
📈 PINS: Flow Chart
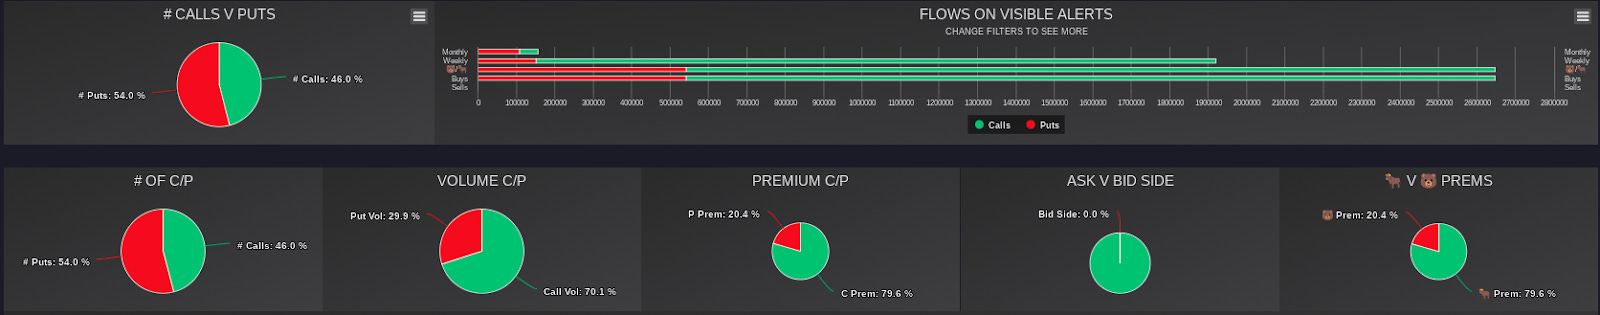
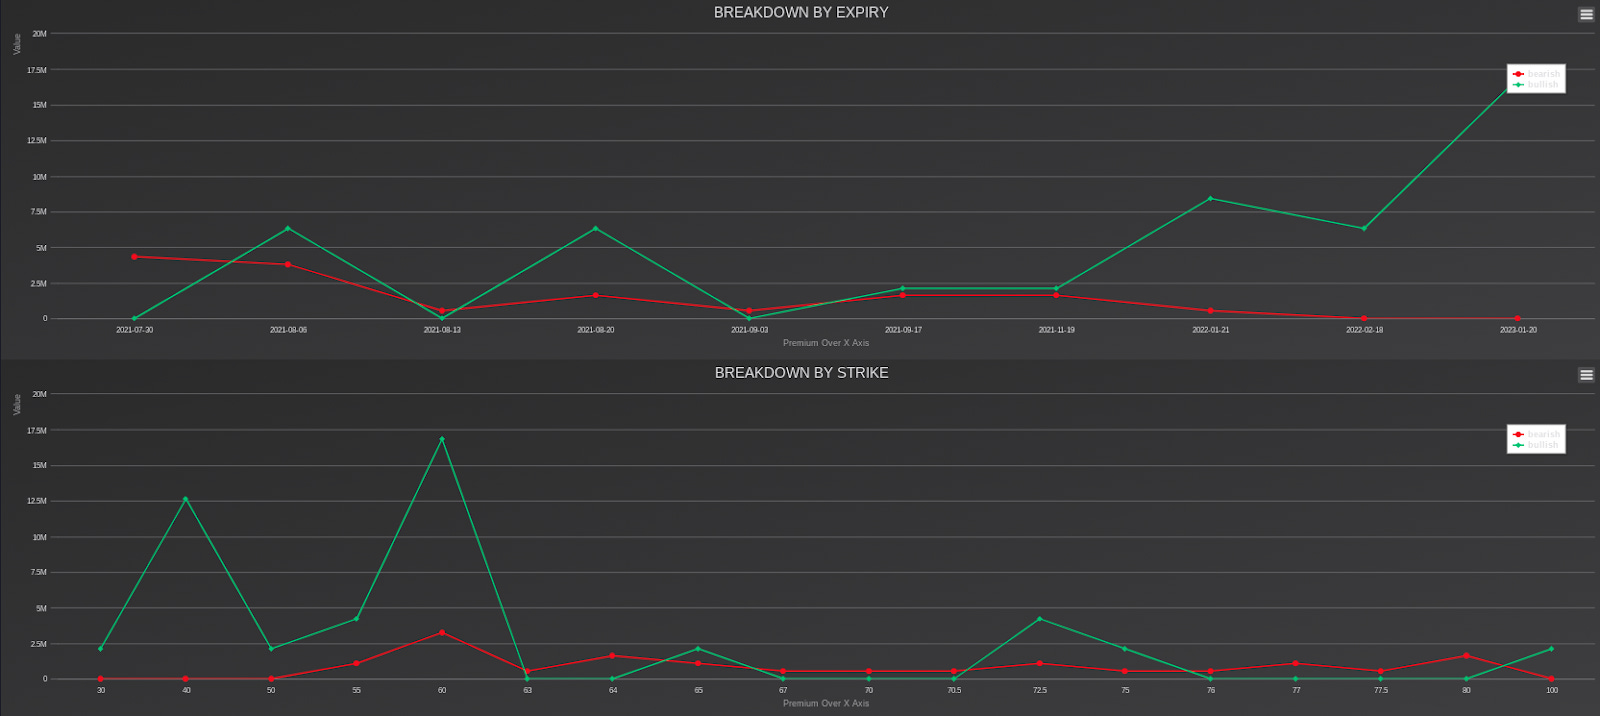
⌚️ PINS: Expirations and Strike
Expiration: A ton of LEAPs being bought for 2022 and 2023.
Strike: Bullish spikes in action on the 40 and 60 strikes.
📊 PINS: Chart
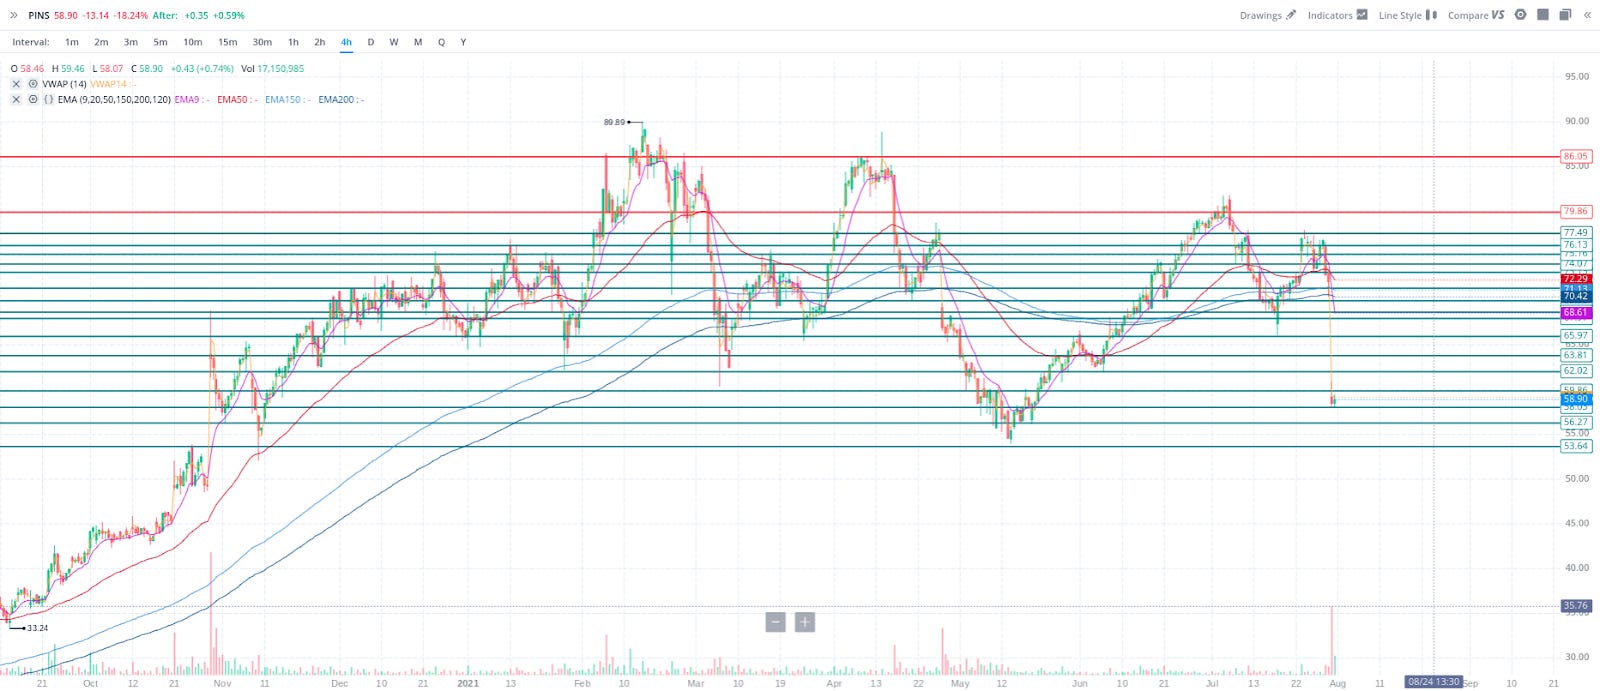
📝 PINS: Levels
Upside: 62, 63.80, 66, 68
Downside: 58, 56.25, 53.65
6. FSLR Calls (1k+)
Recommended by: My uncle, Account Blow Up who simply said: “FSLR. It’s ready.” Say no more.
The Biden administration’s infrastructure pump will definitely benefit this old, forgotten favorite. I like a few things about this setup but especially the chart. It has two degrees of conviction between that and the flow; my body is ready.
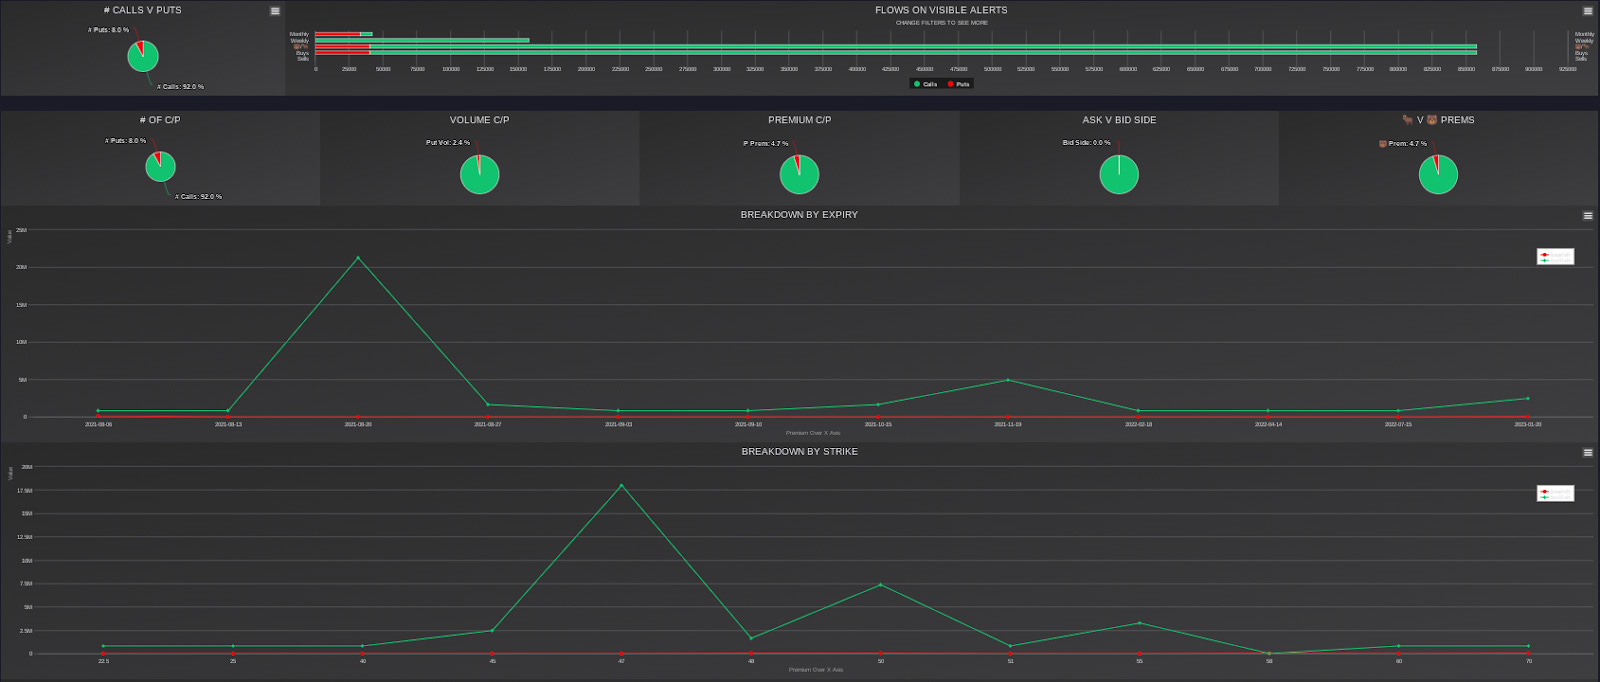
🌊 FSLR: Flow reading
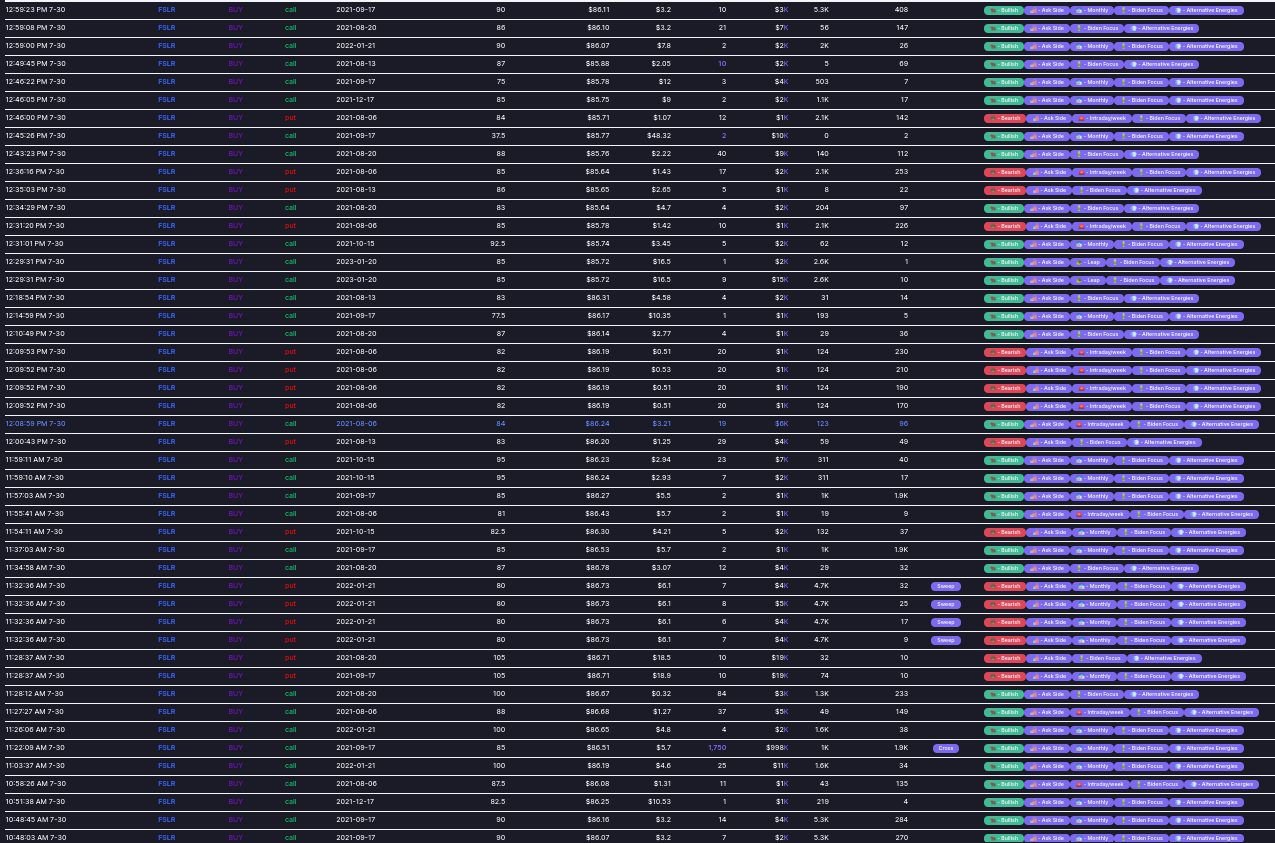
📈 FSLR: Flow Chart
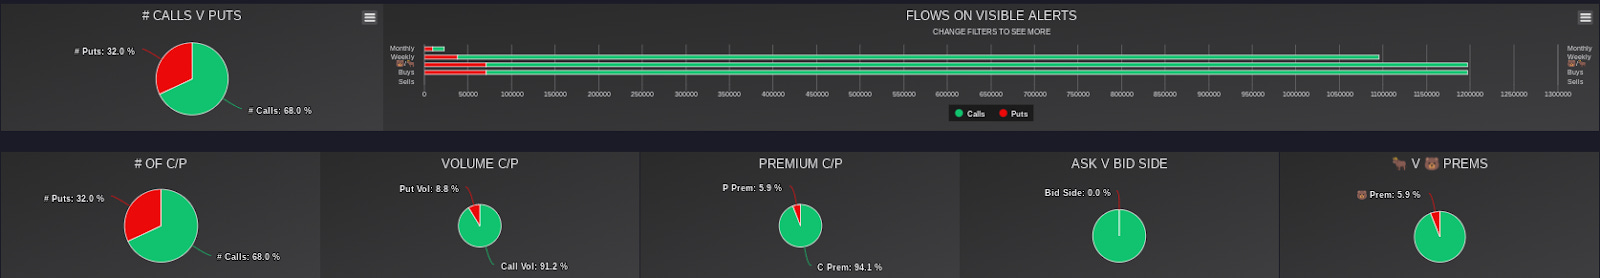
⌚️ FSLR: Expirations and Strike
Expirations: Big bullish spikes on the 9/17.
Strikes: The 85 and the 90 had particularly bullish days, followed by the 100 strike.

📊 FSLR: Chart

📝 FSLR: Levels
Upside: 86.84, 89.17, 90.80
Downside: 84.04, 80.39, 75.73, 71.44
🎲 Earnings BONUS: DKNG Earnings
IF I played earnings, I’d say DKNG is a little too beaten up for such a profitable industry.
IF I played earnings, I’d say that the flow looks great.
IF I played earnings I’d say that PENN reporting just before will give us a good gauge on whether to bail.
If.
🐳 DKNG: Unusual Whales Alert

🌊 DKNG: Flow reading

📈 DKNG: Flow Chart
📊 DKNG: Chart
I acknowledge the rising wedge on the hourly intervals. That being said, ER is a different beast.

🚀 Meme of the week BONUS: SOFI
Mentioned in the SPAC article, but the more I look, the more I think this is my favorite setup of the memes currently.
🌊 SOFI: Flow Read (5k+): Things are looking a tad bit bearish for their Earnings run, as they’re scheduled to report on August 12th. Friday’s flow was 62% bearish, but you can take it with a grain of salt, as pretty much everything took a dump that day.
⌚️ SOFI: Expiration There was a roughly equal split between bearish and bullish action on the 8/20, which makes sense as it’s the monthly expiry just after their earnings. What may stick out as mildly concerning to the SOFI bulls is the large bearish spike in premium on the 2023 LEAP.
🔨 SOFI: Strike Bearish hits on expiration throughout the Friday session, with the 17.5 and the 20 seeing the most activity.
📊 SOFI: Chart
Really like this bull flag on the hourly. Why? Because it’s been holding 15.45 quite nicely.

📝 SOFI: Levels
Upside: 15.82, 16.25, 16.75, 17.06, 17.44
Downside: 15.30, 15, 14.60
🦍 Other Meme Flows:
AMC: the higher the premium, the more bearish it’s getting. Caution.

GME: Equally Bullish and Bearish at 15k+ and 30k+. Large OTM action on 15k+.

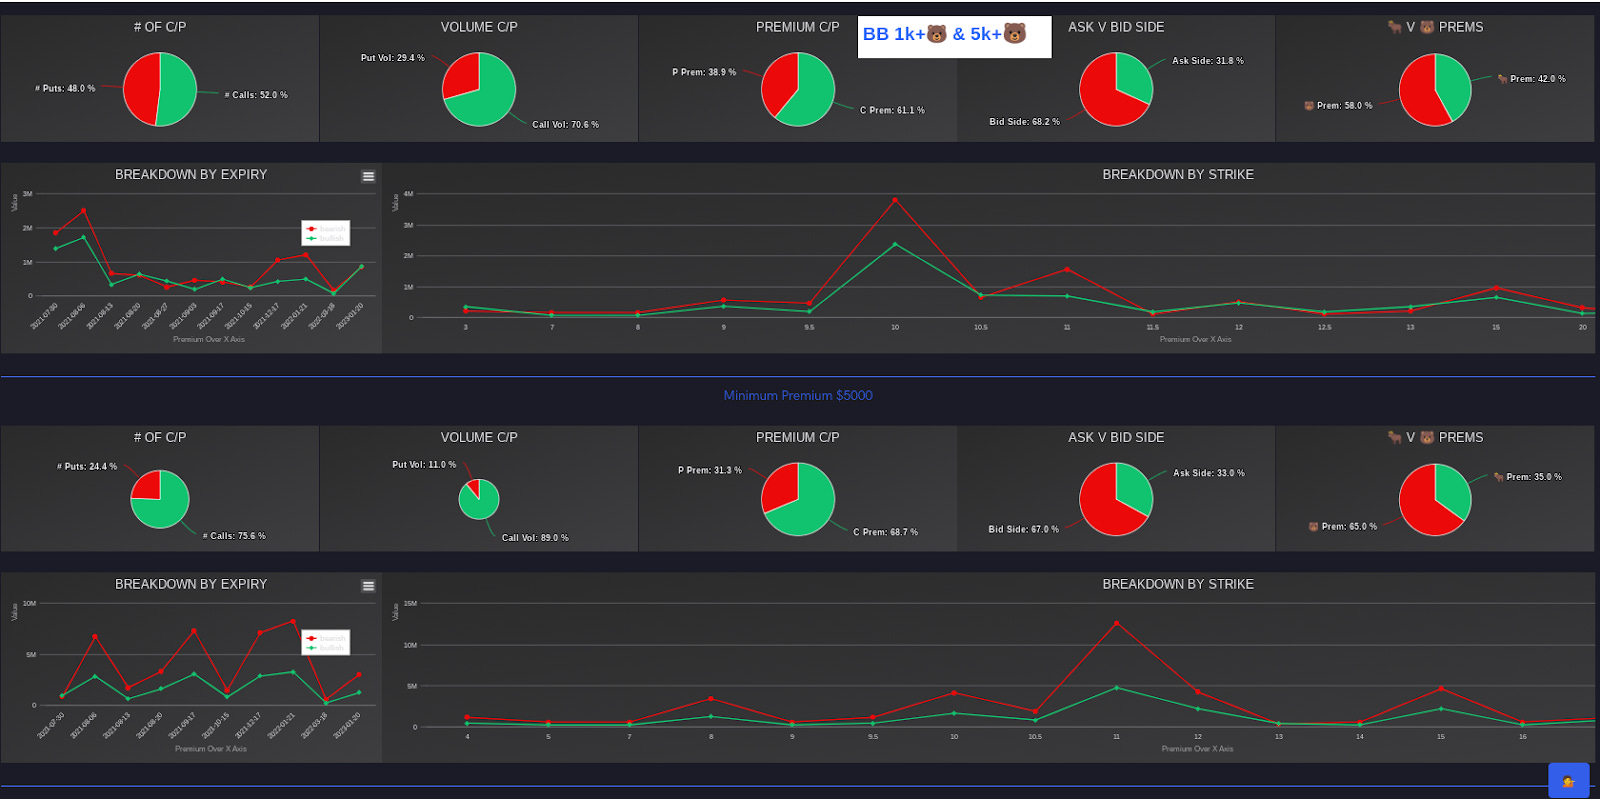
BB: Bearish on both the 1k and the 5k after a nice run.
EXPR: Bullish flow on the 1k+, but worth noting that on the smaller sample size 5k all bets were bullish.

CLOV: Love CLOV, but Friday’s read was slightly bearish across the board on all premium levels (1k, 5k, 15k, 30). With the overall market action on Friday, though, I’m not too deterred by only a slight bit of red. HODL.
🕊Pour one out for the homie: $ATOS

So, swiftly this:

Became this:

The fuck-ups here were actually really simple, and ones that I know better.
Because it is a small-cap speculative biotech stock I didn’t really pay attention to the chart, instead crossing my fingers for some kind of miracle. ALWAYS, always, check your charts to know when it’s time to bail out, no matter how green the flow is.
BioTech and Flow do not mix: If you’re using Unusual Whales or another UOA scanner, OTM alerts beat flow with this sort of thing. You don’t want to follow the crowd, you want to follow really big money placing a jaw-dropping bet.
Rest in power, ATOS 8/20 4c 💀 🕊
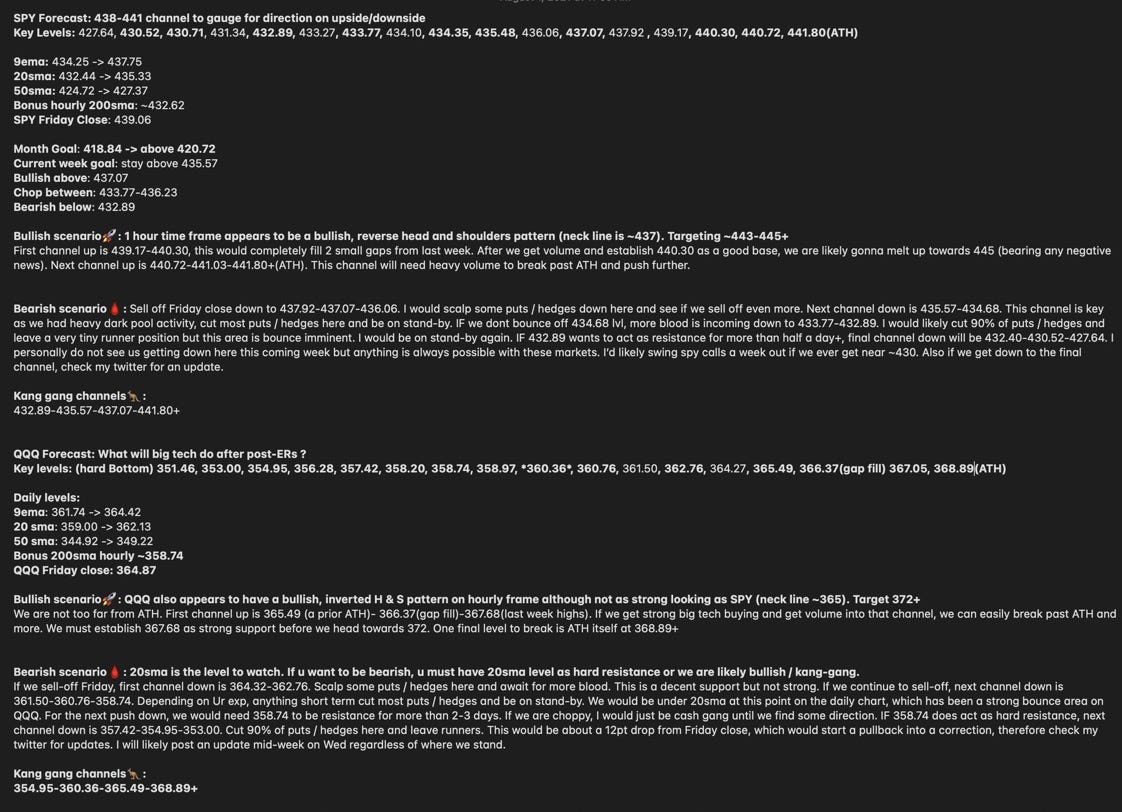
🌦 Pt. 6: Weather: SPY & QQQ Forecast & Watchlist by @daarkmaagician
Below is the SPY & QQQ forecast from @daarkmaagician, check out his DISCORD ( is the link, underlined!) for the accompanying charts tonight (YEETers get two weeks free!).
He introduced me to TA and I can’t say enough how helpful his discord is. Try it for two weeks, and if you don’t like it don’t continue.
SPOILER ALERT: You will continue.
Make sure you follow @daarkmaagician to get updates on the indexes daily!
Pt. 7: TLDR & GOODBYE ✌️
TLDR:
Pt. 2: SPAC DD
Pt. 3: Chart Patterns Tutorial
Pt. 4: HOOD deep dive
Pt. 5: 👀Watchlist: Calls=⭐️PTON, TSLA, SBUX, TLRY, PINS, FSLR
🦍 MEME Watchlist: ⭐️SOFI, AMC, GME, BB, EXPR, CLOV
Pt. 6: Text of Dark’s Forecast
Goodbye and thanks for reading! Questions, scoops, comments @yourboymilt or /u/alldatdalton. See you next week! ✌
Hello - what does bullish delta mean and where does one look for it and how do we interpret it? cheers...