

🥂YEET no. 26: The Great Chadsby
🥂YEET no. 26: The Great Chadsby
Welcome to The Yeet, a weekly DD where we try to tilt the casino...

Hey! I’m @yourboymilt, and welcome to retail’s Sunday Paper.
I should probably let you know...This is not financial advice! We are here to entertain while giving you ideas, perspective, and angles. Do your own research, I prithee. And if you aren’t subscribed, join us here:
Creator/Editor:@YourBoyMilt The Architect: 🧠 Publishing Associate:@YourGirlRachie
Pt. 1: Week’s Thoughts, Pt. 2: Crude Oil DD (@donmiami3), Pt. 3: Crypto DD (@mkt_sentiment), Pt. 4: Watchlist, Pt. 5: Index Forecasts (@daarkmaagician) Pt. 6: TLDR
Editorial Board: @jimengland & @jameoneill
🥂Pt. 1: The Great Chadsby
The Roaring 2020. Earnings beats everywhere. It was all caviar and cocktails as money fell from the sky with each report.
Every fragile facade is eventually exposed, and every party must come to end; the clink of champagne glasses is inevitably followed by the emptiness of confetti on an unoccupied floor.
The past year has been quite a time to be alive for newbies and the experienced alike; on and on the opulence went, until...well...now. This week was a slap in the face, cold water splashing, the screeching halt to a phonograph playing to the tune of unstoppable gains. Not in the indices, which chugged along fine, but in the previously consistent tool at our disposal for multi-baggers. You and I—the new money Chad Bulls living on the glory of the earnings report party—heard the needle scratch to a halt in the most unwelcoming manner this week.
What the hell do you mean that earnings can be bearish?
This week profits were gone in a SNAP, as tech company after tech company took a dive in a spectacular fashion. To understand how troubling this was you’ve got to understand where we came from, and why even the most bullish of bulls must be a little bearish after this bullshit. The past few quarters have been a speculator’s playground when it comes to tech earnings (helping The YEET achieve an unprecedented 10-2 earnings win/loss record). A company gets a beat on revenue? Stock soars +15%. Earnings per share smash expectations? Stock rips 20%, at a minimum. And, my God, if they sprinkled in some bullish forward guidance? We all remember the miraculous day CRM went 40% off their earnings report.

So, well, what the hell is going on now?
On its surface this recent earnings skid is the music stopping after tech was deemed the be-all and end-all of American profitability. After Covid kept us locked inside like a creature from “Midnight Mass”, the only thing that made sense in our crazy cooped-up world was life lived through screens. It wasn’t just market opportunism and optimism—we saw the shift in the world all around us. Your realization may have been your grandmother sharing her Postmates referral code, attempting to make that $5 credit off you. Or perhaps it was the panhandler outside Target, putting you on the spot in front of your significant other by saying he now took Cash App. Or maybe, just maybe, it was your grandfather quietly streaming adult entertainment from his favorite recliner, not realizing he was connected to the Bluetooth in the kitchen.

I’m not saying the world hasn’t changed, and I’m definitely not saying your Grandpa is going to quit surfing his sites of interest, but I am saying the age of unending tech delirium may be—at the very least—making room for others. Recent performance of the DOW just can’t be ignored, try as we might to replace BAC with SOFI:
The Dow climbed nearly 74 points, or 0.2%, to 35,677.02, its first record close since Aug. 16. The S&P 500 edged lower by 0.1% to 4,544.90 a day after the benchmark closed at a record. The Nasdaq Composite shed 0.8% to 15,090.20.
On the month, the S&P and Dow are up more than 5% while the Nasdaq has gained 4.4%.
The Dow got a boost Thursday as investors rotated out of tech stocks and into blue-chips. American Express led the index higher with a 5.4% gain on the back of a strong earnings report.
So the sector rotation argument there is obvious, but it’d be too simple to dismiss the disappointments of SNAP, INTC, and others as simply due to a shift into boomer stocks. The INTC miss was blamed on a creeping, nagging problem that has dogged tech for a year; a chip shortage resulting from those ubiquitous “supply chain issues”. INTC revenue miss? Supply chain issues. Biden’s approval rate falls? Supply chain issues. Lil’ Durk cheats on his baby momma?! Supply chain issues, yet again, my friend.

As for SNAP specifically? Apparently Tim Cook’s privacy crusade has all but destroyed the ability for SNAP and similar stocks to hit ER dingers. With apologies to SNAP bagholders, the story here isn’t so much about Ghostface Chillah—it’s about what AAPL could be doing to the entire sector:
Shares of Snap Inc plunged on Friday, dragging down other ad-dependent tech firms, after the photo messaging app owner warned of a prolonged hit from Apple Inc’s privacy changes on iOS devices.
Snap shares were down nearly 20% at $60.8 before the bell, on track to open at a near three-month low. Shares of Facebook, Google parent Alphabet Inc and Twitter were down between 2% and 4%.

It’s the exposing of it all, at once, that makes it seem like our party is coming to an end. Supply chain issues catching up with profits, big tech cannibalizing themselves, and looming regulatory issues all seem to spell the demise of the perma-bull Chadsby. The lack of near-guaranteed tech earnings profit boosts puts our whole new money rouse in jeopardy, threatening us with having to actually invest rather than gamble our way to account values of respectability. Perhaps that’s why the coming week is more important than any we’ve seen for tech in a year’s time:
An earnings avalanche is coming in the week ahead that could put the stock market’s recent gains to the test.
Apple, Microsoft, Alphabet, Facebook and Amazon — the biggest of big cap tech — are among the 30% of the S&P 500 companies reporting.
“Next week is the real test,” RBC head of U.S. equity strategy Lori Calvasina said.
“The tug-of-war in good versus bad earnings reports has landed in favor of the market with the S&P hitting an all-time high [Thursday]. That may run into difficulty next week,” National Securities chief market strategist Art Hogan said. “We may finally be seeing some cracks in the earnings season.”
Most new traders are probably too poor to buy calls of AMZN or GOOG, and too lazy to figure out how to actually calculate the intricacies of a debit spread (it’s really not that hard, lol). But even on the sidelines, we should all be watching which way the wind blows this week for tech; a rising Treasury Yield, and less than stellar earnings reports coming, could very well replace Chad Bulls’ champagne glasses with bags.
The closely watched 10-year Treasury yield continued to edge higher in the past week, touching 1.70% before falling to 1.64% Friday. Market pros are watching to see if the yield will reach 1.74%, the closing high from March, and whether it will begin to worry stock investors. The 10-year yield hit this year’s intraday high of 1.776% on March 30.

The chase for profits through options and investing, for me, was like the scramble for austerity that Gatsby cobbled miraculously into a life. I was younger then. I’d spent time parsing the difference between being rich or being wealthy— I’d achieved neither yet I wanted both, and decided I’d settle for a taste of just one. Options trading was the bootlegging business to achieve quick wealth, ten-baggers were the coveted Daisy out of reach, and earnings the raucous party where opportunity and ambition met time and time again. What is the art of the YOLO without the promises of soaring tech earnings? Well, I suppose that’s as nonsensical as Gatsby chasing Daisy without a party.

East Egg is still clear in sight, but the bay between our life and the one we desire expands wider without tech gliding us toward those lights in the distance. For better or worse, I think it may be time to embrace our inner boomer; a continued sector rotation could be the only thing keeping us from lying face down in a pool, the Great Chadsby doomed, all out of time, speculative YOLOs and BP.
Despite the obstacles and warning signs telling us to halt, I have a hunch that we’ll keep YOLOing caution into the wind. I imagine that we tech bulls will beat on, against the current, borne back ceaselessly into the past.
Welcome to YEET no. 26, brought to you by Nick Carraway
🛢Pt. 2: Crude Boys Vol. 1—A Unique Look at Oil with Milt and The Don
Contributor: @donmiami3
You may think oil is on your mind, but nobody cares as much about the crude as my good friend and energy junkie @donmiam3. We got to chatting a bit, and there are some interesting things happening in oil outside of what you see in the standard OPEC+ news fare.
Also please note @donmiam3 is basically wealthy off $DWAC and we should be grateful for him to grace us commoners with his knowledge 🤣 Love ya Don!

Remember last year, when there was a pandemic oil crisis so FUBAR that you literally couldn’t pay somebody to take your oil? Well, looks like times are-a-changing if the recent energy boom is any indication. The desire for oil has reached levels of ridiculousness as reopening gets into full swing, with or without Delta variant concerns. What’s critical in this snapshot analysis of the oil scene, however, is what’s going on in the little known—but super important—city of Cushing, Oklahoma.
Stockpiles at [Cushing], the biggest U.S. crude depot are quickly approaching critically low levels. The last time that happened, crude cost more than $100 a barrel.
The storage tanks in Cushing, Oklahoma, require a minimum level of oil to maintain normal operations, which traders generally believe is around 20 million barrels. Unusually for this time of year, stockpiles declined more than 4 million barrels over the past two weeks to 31 million and are expected to keep dropping rapidly due to the world's insatiable demand for U.S. light sweet crude.
What’s happening at Cushing is part pragmatic and part bellwether, and should be taken as a serious sign of bullishness for oil. From a practical standpoint, the Cushing hub depletion means naturally soaring prices as it’s the hub of U.S. crude and the measurement for futures. As a bellwether indicator, Cushing’s literal running out of oil supply should be seen as an indicator of the demand constraints arriving globally on oil as a whole.
Still don’t believe that this town alone indicates a rise in oil prices? Check out what this in-the-know nerd at J.P. Morgan has to say:
J.P. Morgan analysts say Cushing could be just weeks away from effectively running out of crude, based on current rate of draws, which could cause WTI spreads to spike to record highs in a "super backwardation scenario."
“Super backwardation” sounds like a made up term, but apparently it is not (I promise, I’ve checked). This scenario is all coming together beautifully for us energy bulls, and this is the green light you’ve needed to YEET your BP at BP like a young Daniel Day Lewis. Now that we’ve shown you what’s going down with oil in Cushing, what do you do?
You follow the charts in @donmiam3’s Watchlist, and make some decisions with some of these sweet sweet setups! He was kind enough to bless The YEET with some tickers he follows, so without further ado here are some charts and flows my friends:

🌊Flows on the charts above:
CDEV 1k+ Premium: 99.2%🐂
CPE 1k+ Premium: 89.2%🐂
CPG 1k+ Premium: 65%🐂
AR 1k+ Premium: 90.8%🐂

🌊Flows on the charts above:
IMO: Go shares👴
LPI 1k+ Premium: 91.7%🐂
XOP 10k+ Premium: 90.1%🐂
SM 1k+ Premium: 99.9%🐂
Happy oil hunting, gang!
🪙Pt. 3: How to consistently make returns from the Crypto market!
Written by: @mkt_sentiment
We have all come across news articles that discuss people who made insane gains in the crypto market like the trader who turned $17 into ~6MM or Dogecoin millionaires who invested a considerable amount right at the beginning of the rally.
But the problem with these strategies is that it’s heavily based on luck and for every winner, there would be hundreds of folks who lost all of their investment [1]. While it’s great to be that guy who made a 1,00,000% gain in an investment, the realistic chances of that happening is slim to none.
So in my first-ever analysis covering the crypto market, we are diving deep into the data to create a strategy that will give us consistent returns year over year while trying to minimize the downside.
Data
There were a number of sources available for cryptocurrency data, but many of these sources had issues - They were either expensive, incomplete, or required separate signups. After extensive testing, I decided on a single source that solved many of these issues.
The data for this analysis was extracted using the CoinGecko API which had aggregated historical data across 317 different exchanges related to price, market capital, and the trading volume for thousands of cryptocurrencies. In most cases, the data was available even up to the time that the cryptocurrencies were initially listed!
All the data used in the analysis is shared as a Google sheet at the end.
Results
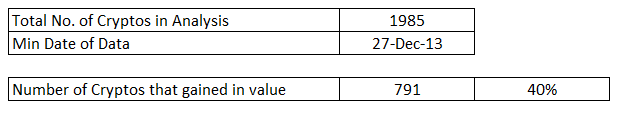
Daily price and volume data for 1,985 cryptos were collected with data going back up to 2013 for some currencies. If you compare the first listing price on the exchange and the latest available price, only 40% of them have gained in value.
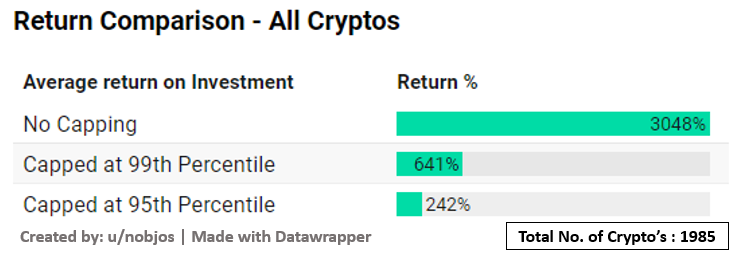
Even though you have slightly less than a coin toss probability of picking a winner, the average gain across the currencies was a whopping 3048%! What is more interesting is the impact of outliers. If you just remove the top 1% of the currencies, the returns drop down to 641% and if you remove top 5% of the currencies, your return would only be slightly higher than the S&P500!
Now the challenge becomes a question of how to make sure that you are consistently picking the top currencies that will gain in value over time. While you can try your luck at picking something that will end up in the top 1% and then get featured in the news for insane gains, the chances that you will pull it off are very low.
What I have tried to create is a Dollar Cost Averaging strategy for the Crypto market based on the popularity/trading volume of the Currency. Before we jump into the exact strategy, here is a visualization of how the Crypto market has changed over the years.

In case the visualization is not loading in your mail, check it out here.
As you can see there has been a lot of turnover over the years with a few currencies maintaining their top 10 positions.
The strategy I have created is simple. On the 1st of every month, you check what the top-10 [2] traded currencies of the last month were and invest in them. For example, if I am investing $100 on 1st Nov 2021, I will check what were the most traded (i.e popular) cryptos in the past month (in this case Oct'21) and then invest in that. By following this strategy, you are not jumping into any investment. You are just methodologically checking the popular cryptos at the beginning of the month and investing in them.
The underlying principle was to create a straightforward strategy that can be followed by anyone without luck coming into the factor. Now there would be two ways to invest in the top 10 currencies. You can either split your investment equally across the cryptocurrencies or split it in the proportion to the traded volume.
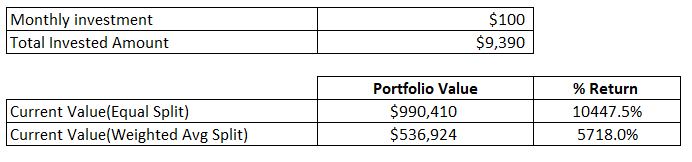
Both strategies give amazing returns but equally splitting your investment produces almost double the weighted average split. This is mainly due to these reasons:
As we saw from the trading volume chart, the volume is extremely skewed towards Bitcoin. So if you do the weighted average split, most of your investment will go into Bitcoin and your returns would be pegged majorly to Bitcoin.
By doing an equal split, you are taking on much higher risk (as you are investing in relatively smaller cryptos) and you are being rewarded for the extra risk you took. [3]
But now you would be wondering whether this is applicable only for those who started in 2014. Sure, they would have made money in the crypto market.
What if I had started late? Would my returns be significant enough to follow this strategy?

This chart should put all the apprehensions to rest. No matter which year we had started, by following the DCA strategy, we would have made a significant return on our investment [4].
Limitations
This analysis comes with its own limitations.
We are relying on the data produced by one company (CoinGecko). While they track more than 300 exchanges, we might have missed out on some other popular cryptos that were not traded in the exchanges tracked by CoinGecko
There are more than 2200 dead coins - but the majority of them were not listed on any big exchange (due to which we won't have data) and if particular crypto became popular (like top 100 in trading volume) at any time, the chances of them dying out completely is very low. (In the 2,000 cryptos we have data for, from 2013, only 3% became inactive completely)
Conclusion
While there are index funds/tokenized ETF’s available for Cryptos, they usually charge an exorbitant expense ratio (Bitwise Index fund charges a whopping 2.5% [5]) and have not been around for long enough to reliably trust them with your funds.
It certainly is alluring to be that guy who can now retire after making a $17 investment in the right cryptocurrency. But then again, you have similar chances of winning the lottery.
Certainly, you can invest in one currency if you completely believe in its long-term prospects and viability. For the rest of us who might not have the time and capabilities to research and invest in individual cryptocurrencies, I guess the 10,000%+ return on your invested amount is plenty good enough!
Price, Volume, and Market cap data collected for all Cryptos: here (It’s around 100MB in size and has ~1.2MM rows)
Analysis Sheet: here
Footnotes
[1] As we found later in the analysis, approximately 60% of the listed currency lost value over the tracking period.
[2] I took top-10 as it felt like a realistic number of cryptos to keep track of. The results would be different if you choose the top 100 or top 5. If you are planning on following this strategy, please optimize the number of cryptos based on your risk profile and the time you can invest in this exercise.
[3] Do note that extra returns are not always guaranteed just because you are taking a higher risk. There is a concept of Beta in stock markets. Beta measures the volatility of stocks. Investing in stocks having higher volatility (say +3 or +4) will net you higher returns when the market is going up but if the market turns, your losses also will be proportionally higher when compared to stable stocks.
[4] Even if you had started your investment at the peak of the 2016-17 rally, you would have made a 629% return to date.
[5] The below chart from Vanguard shows the impact of 2% fees over a 25 year period for a $100K investment.

👀 Pt. 4: The Whale Watchlist Picks
Guest Watchlist by: @SpyGuyTrading
Sometimes, when it comes to banging picks, someone is so smooth with it, so accurate with it, you think you may be in the presence of 007. Well, that’s how it goes with my man @SpyGuyTrading who came on the scene like a whirlwind and has been murdering things with his easy to understand (and profitable to copy!) style of plays. I was honored that he took the time to give us a couple plays that he’s looking at; make sure you show that YEETer love, follow him, and maybe LEARN a thing or two.
Without further ado here he is…
🕵️♂️ Guest Watchlist (@SpyGuyTrading) : PLTR, BABA
🤾♂️ YEET Watchlist: PDD, FDX, CHWY, PTON
@SpyGuyTrading’s Picks:
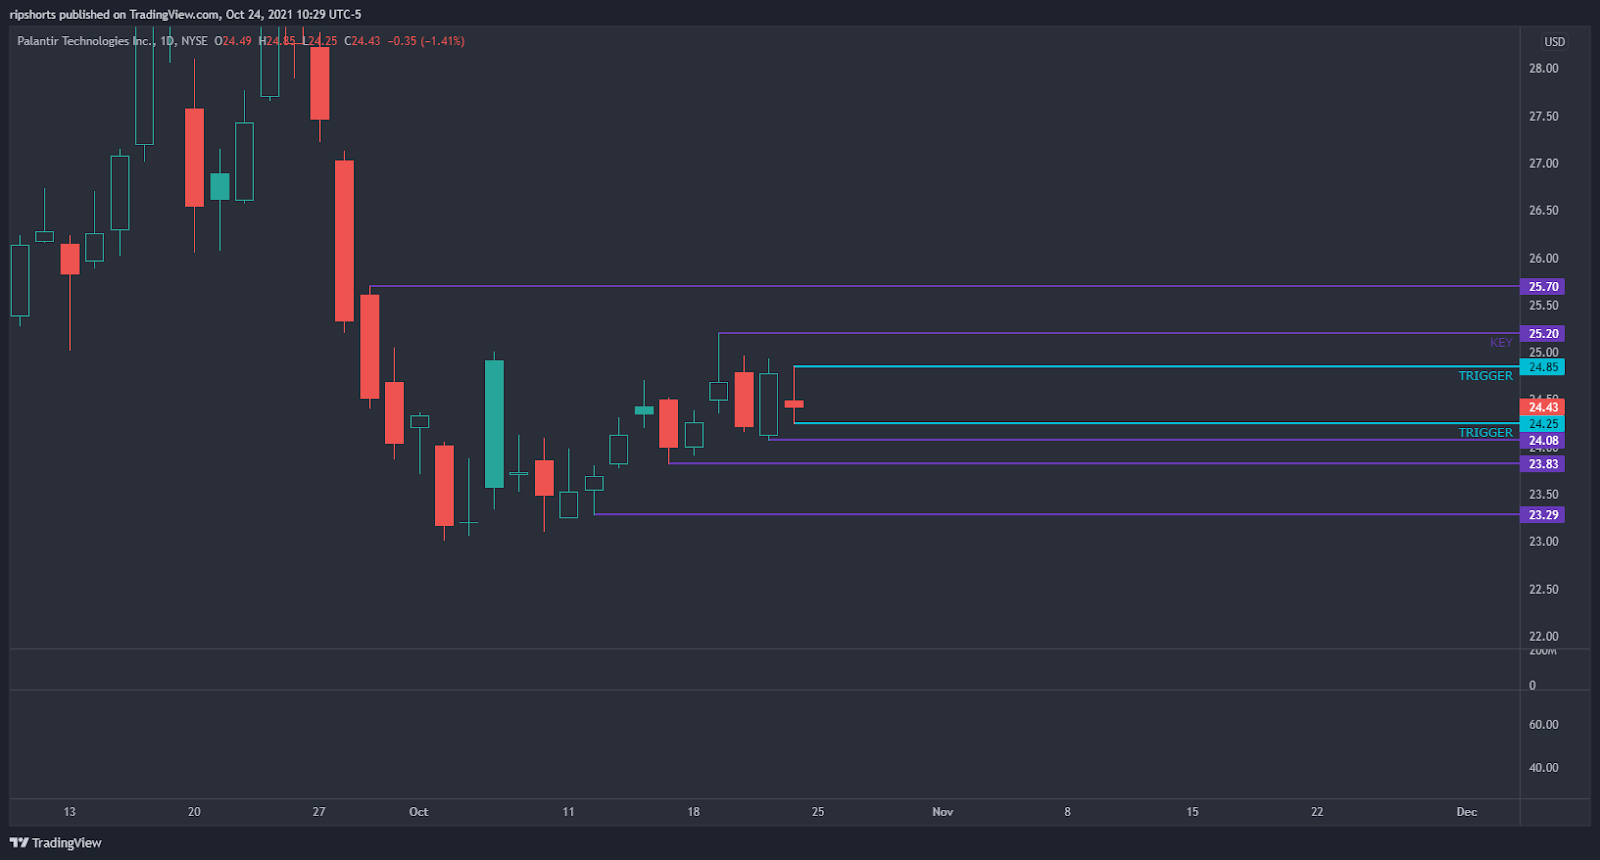
1. $PLTR
Palantir formed a nice Inside Bar on the daily that caught my attention.
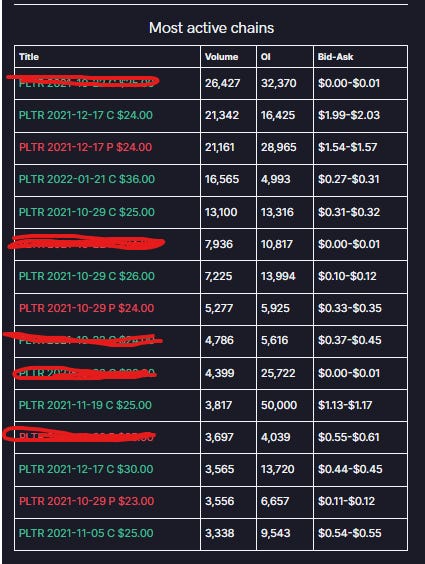
Looking over the most active chains, short term bulls are targeting -
⌚️PLTR: Expirations and Strike
⌚️ Expiration: 10/29
🔨 Strike: $25, $26
📝 PLTR: Levels
Upside - $24.85
Downside - $24.25
📊 PLTR: Chart
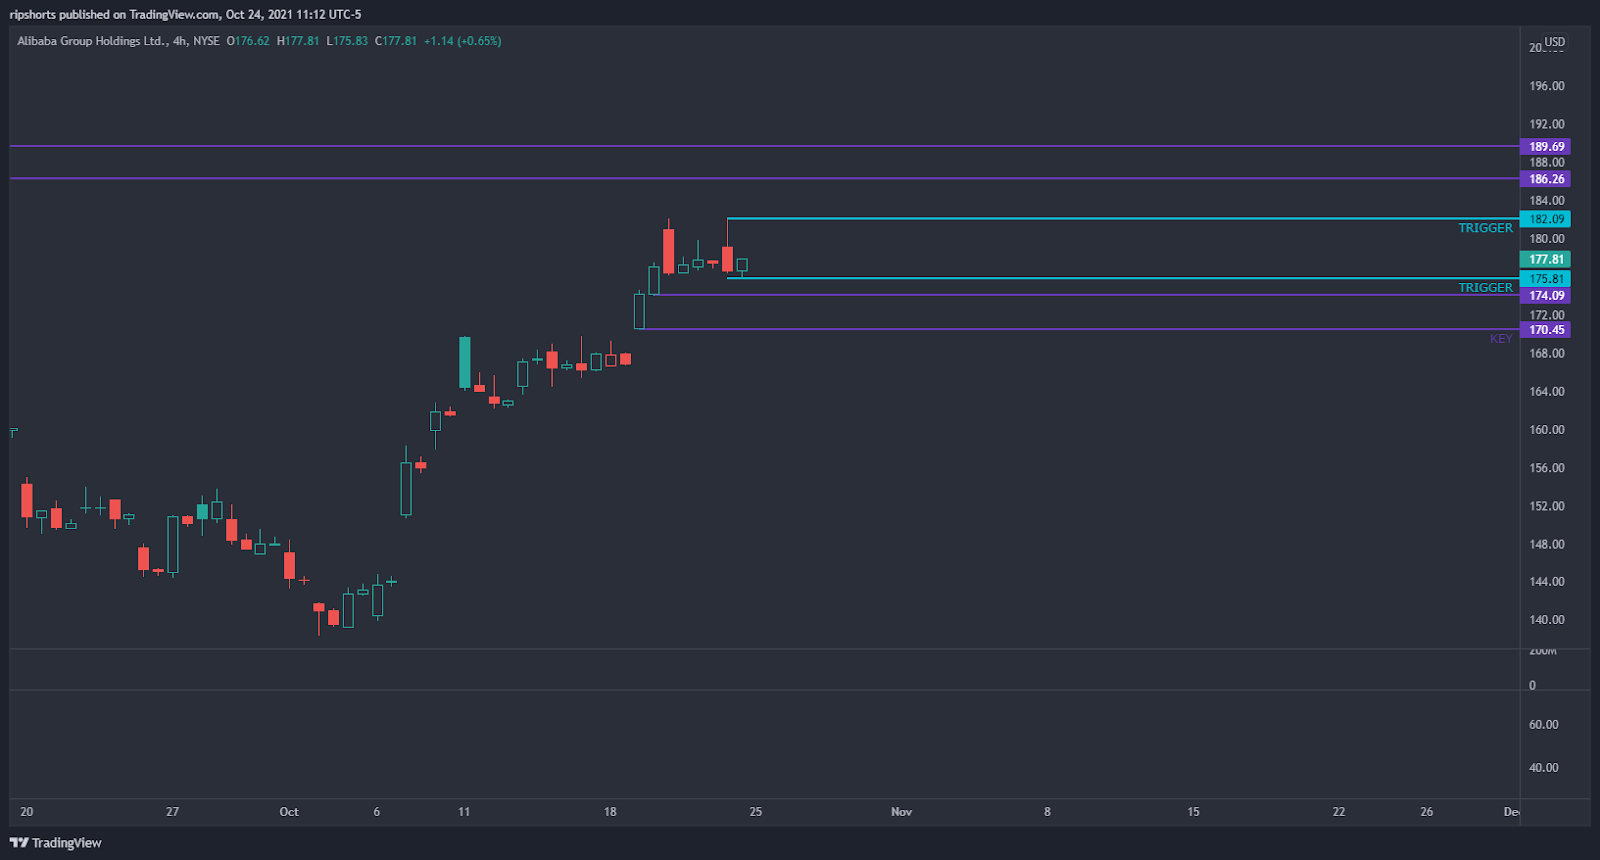
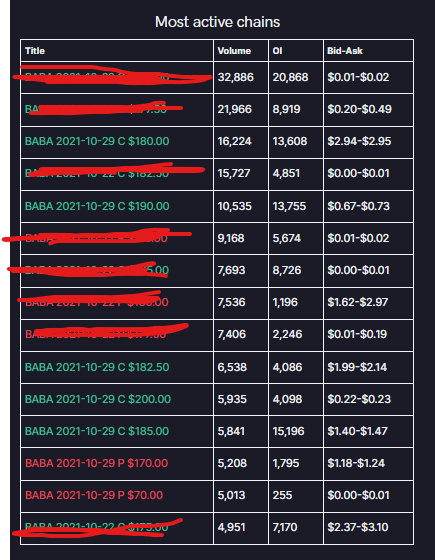
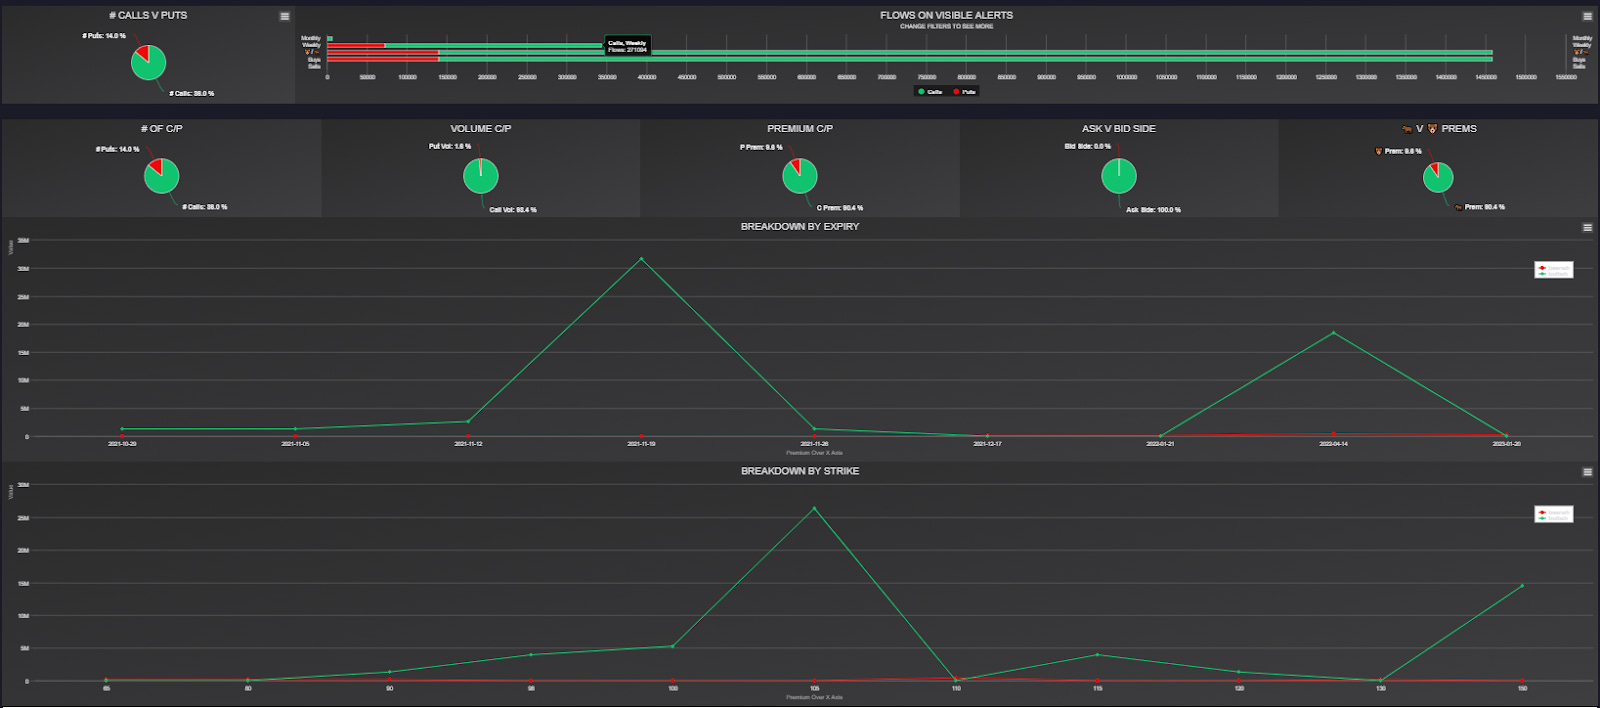
2. $BABA
Seeing a price base out here the last couple days.
Massive bull flow coming through with Call V Put Premium sitting at:
📞Call - $93.8M : 👿 Put - $30M

Chains being hammered for this upcoming week:
⌚️BABA: Expirations and Strike
⌚️ Expiration: 10/29
🔨 Strike: $180, $190, $182.50, $200
📝 BABA: Levels
Upside: $182.09 Downside: $175.81
📊 BABA: Chart
👀 YEET Watchlist: PDD, FDX, CHWY, PTON
1. PDD Calls > 104.57
📈 PDD: Flow Chart 5k+ Premium: 90%🐂
⌚️ PDD: Expirations and Strike
⌚️Exp: 11/19, LEAPs🐂
🔨Strikes: 105, 150 🐂
📊 PDD: Chart
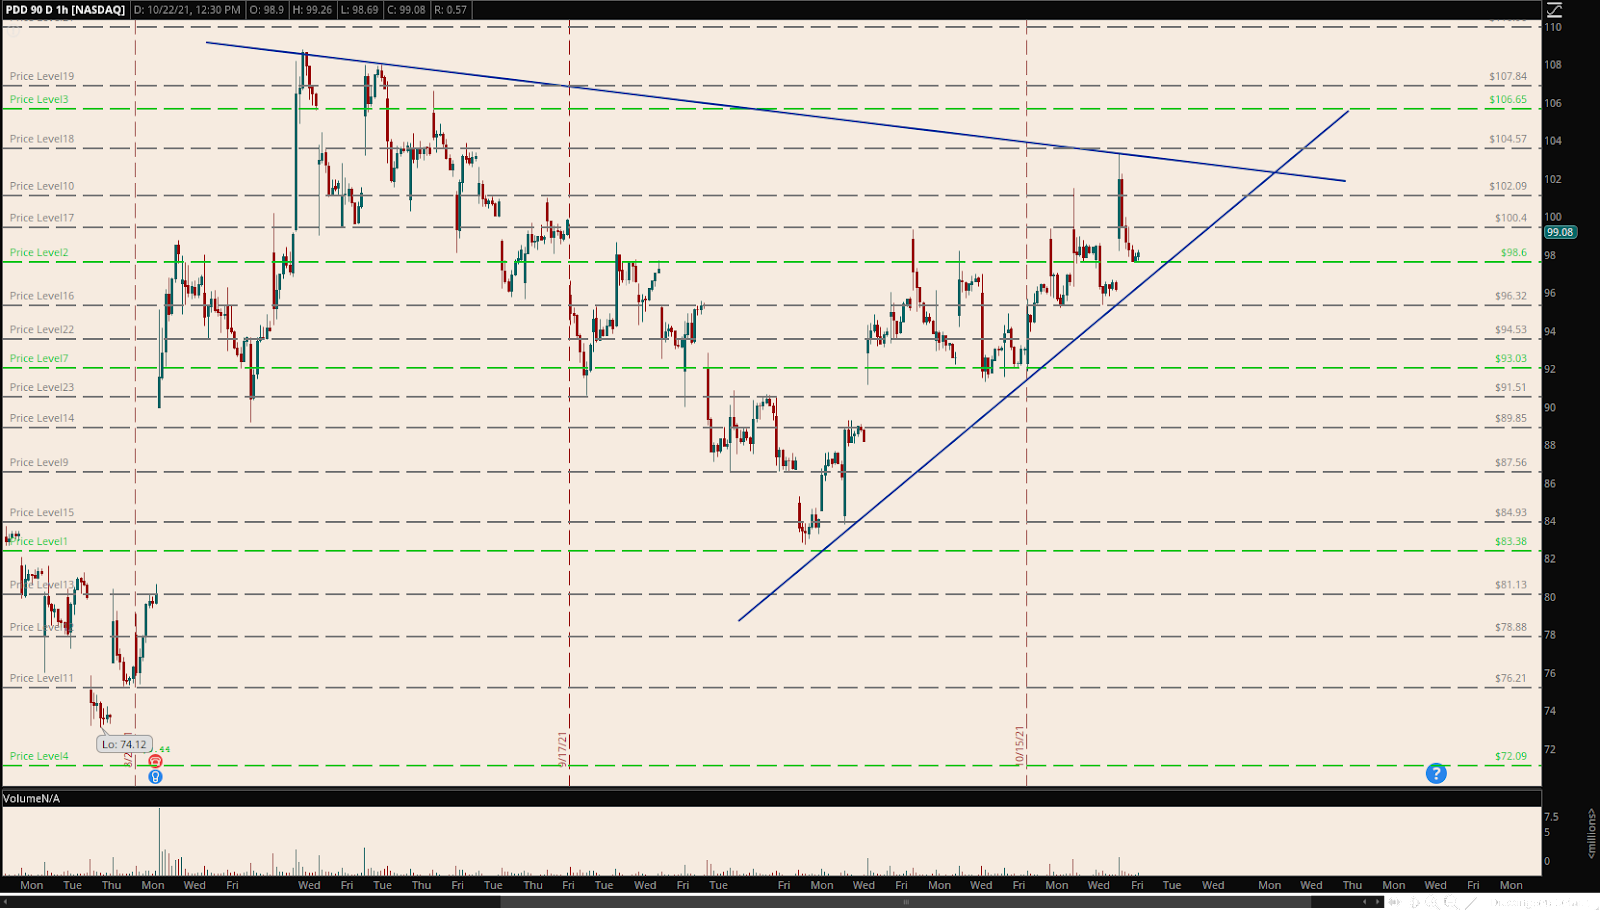
🔫 The Trigger: 104.57
2. FDX Calls> 235
📈 FDX: Flow Chart 1k+ Premium: 60%🐂
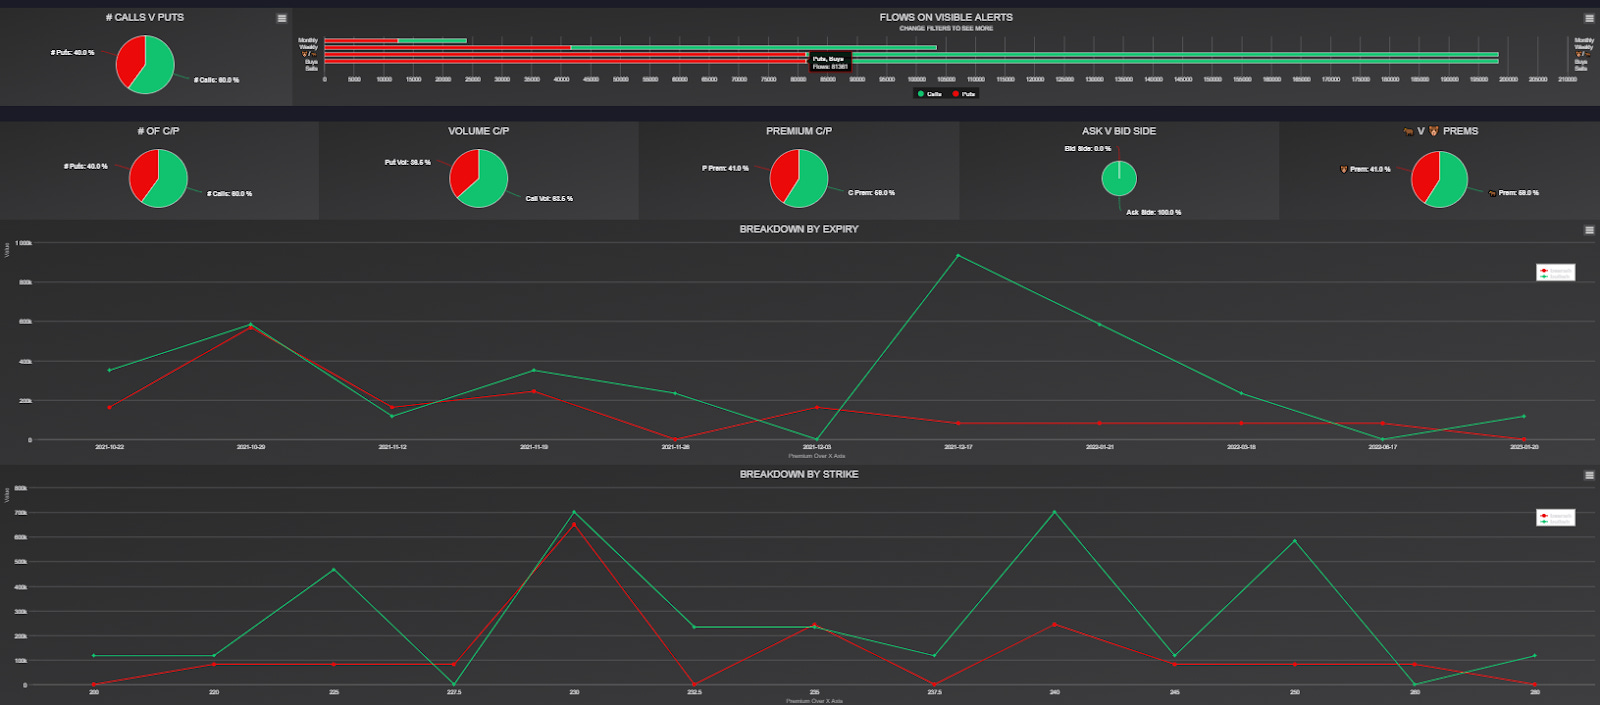
⌚️ FDX: Expirations and Strike
⌚️Exp: 12/17🐂
🔨Strikes: 230, 240, 250 🐂
📊 FDX: Chart

🔫 The Trigger: 235
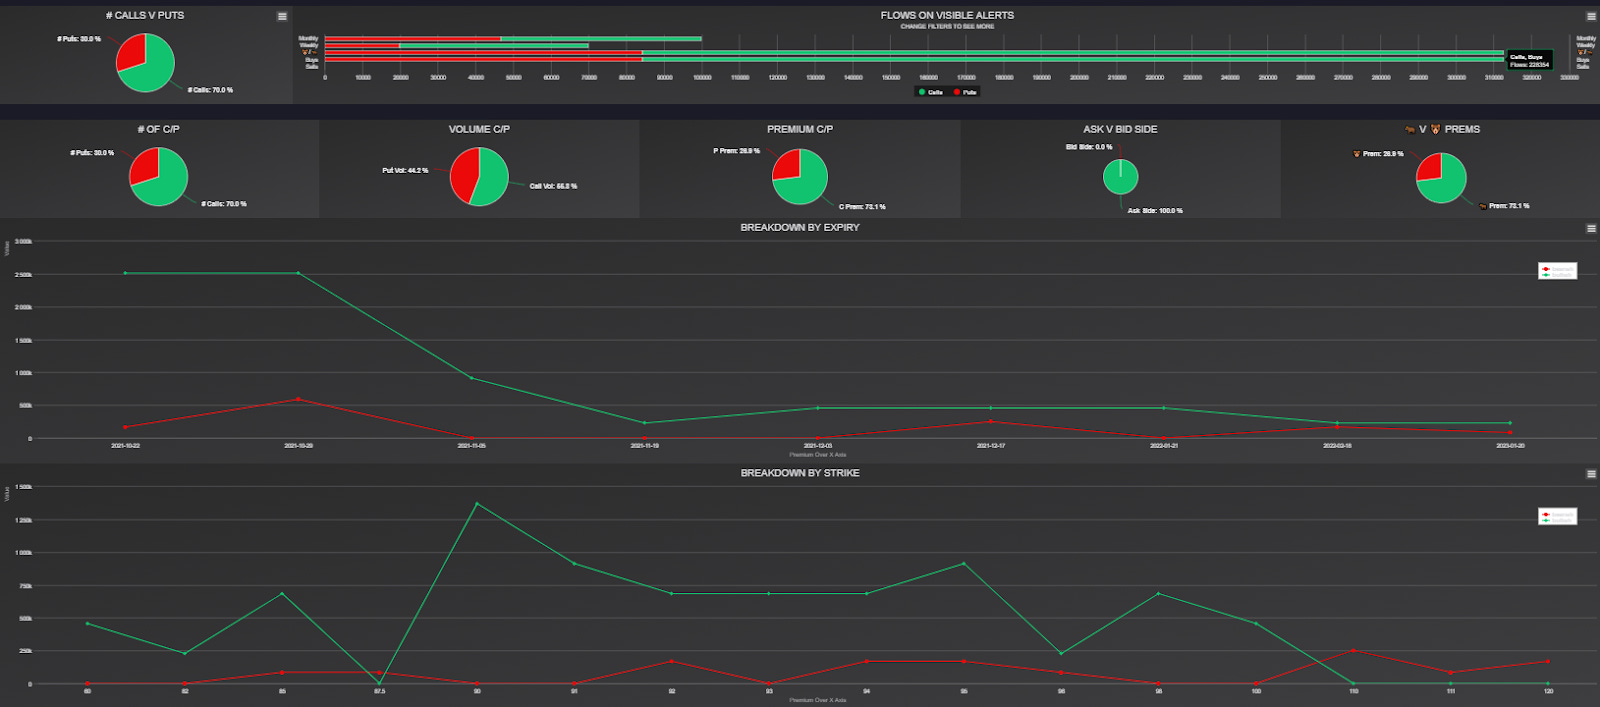
3. CHWY Calls > 67.2
📈 CHWY: Flow Chart 1k+ Premium: 82%🐂 (weird broken up iceberg order for 11/19)

⌚️ CHWY: Expirations and Strike
⌚️Exp: 11/19🐂
🔨Strikes: 71 🐂
📊 CHWY: Chart
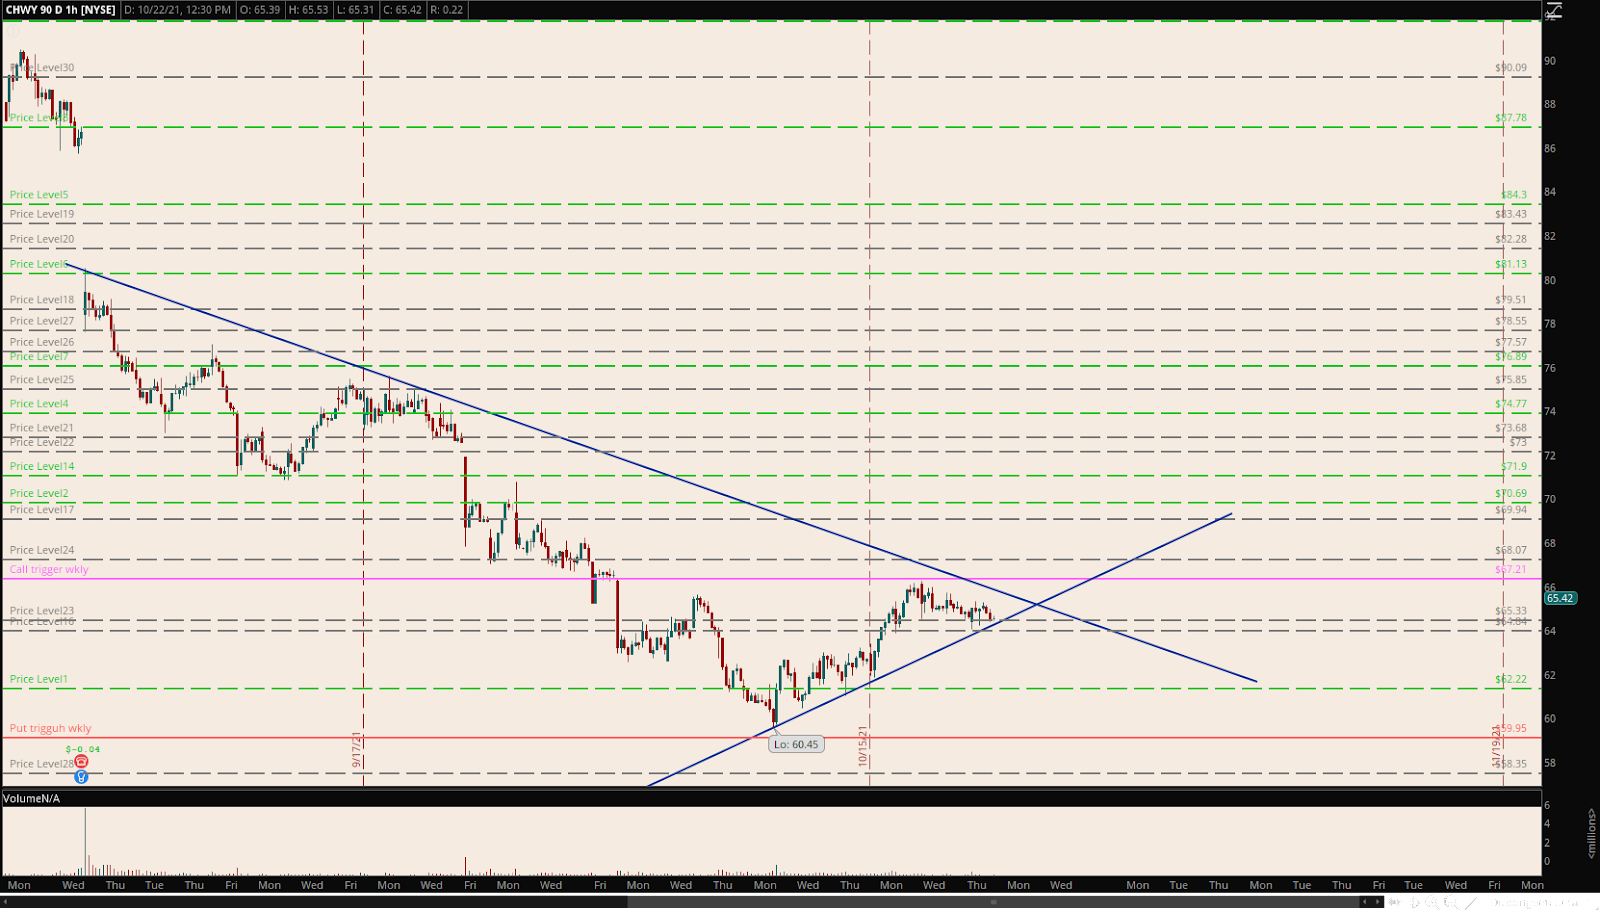
🔫 The Trigger: 67.2
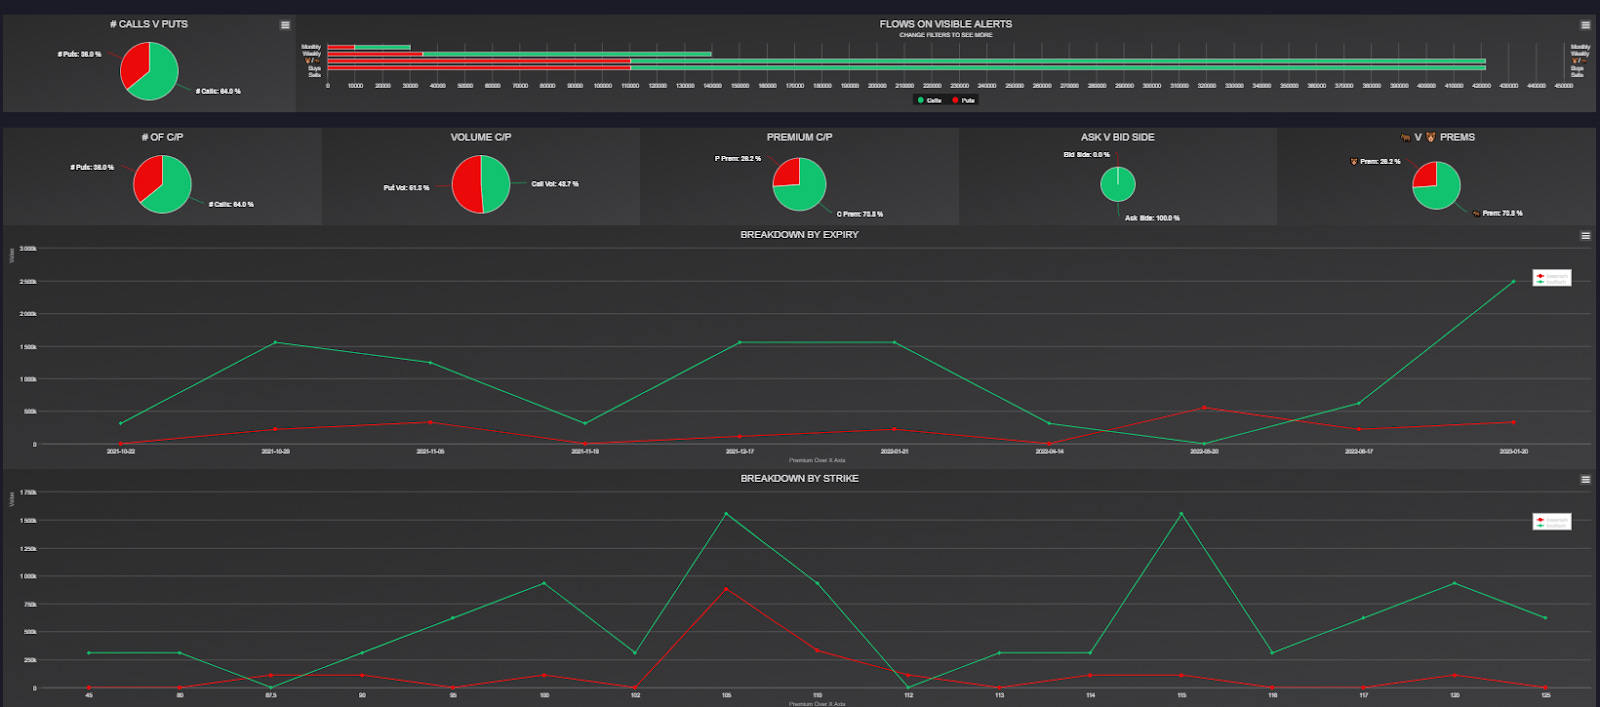
4. PTON Calls > 95.05
📈 PTON: Flow Chart 2500+ Premium: 72%🐂
⌚️ PTON: Expirations and Strike
⌚️Exp: 10/29🐂
🔨Strikes: 90, 95, 98 🐂
📊 PTON: Chart
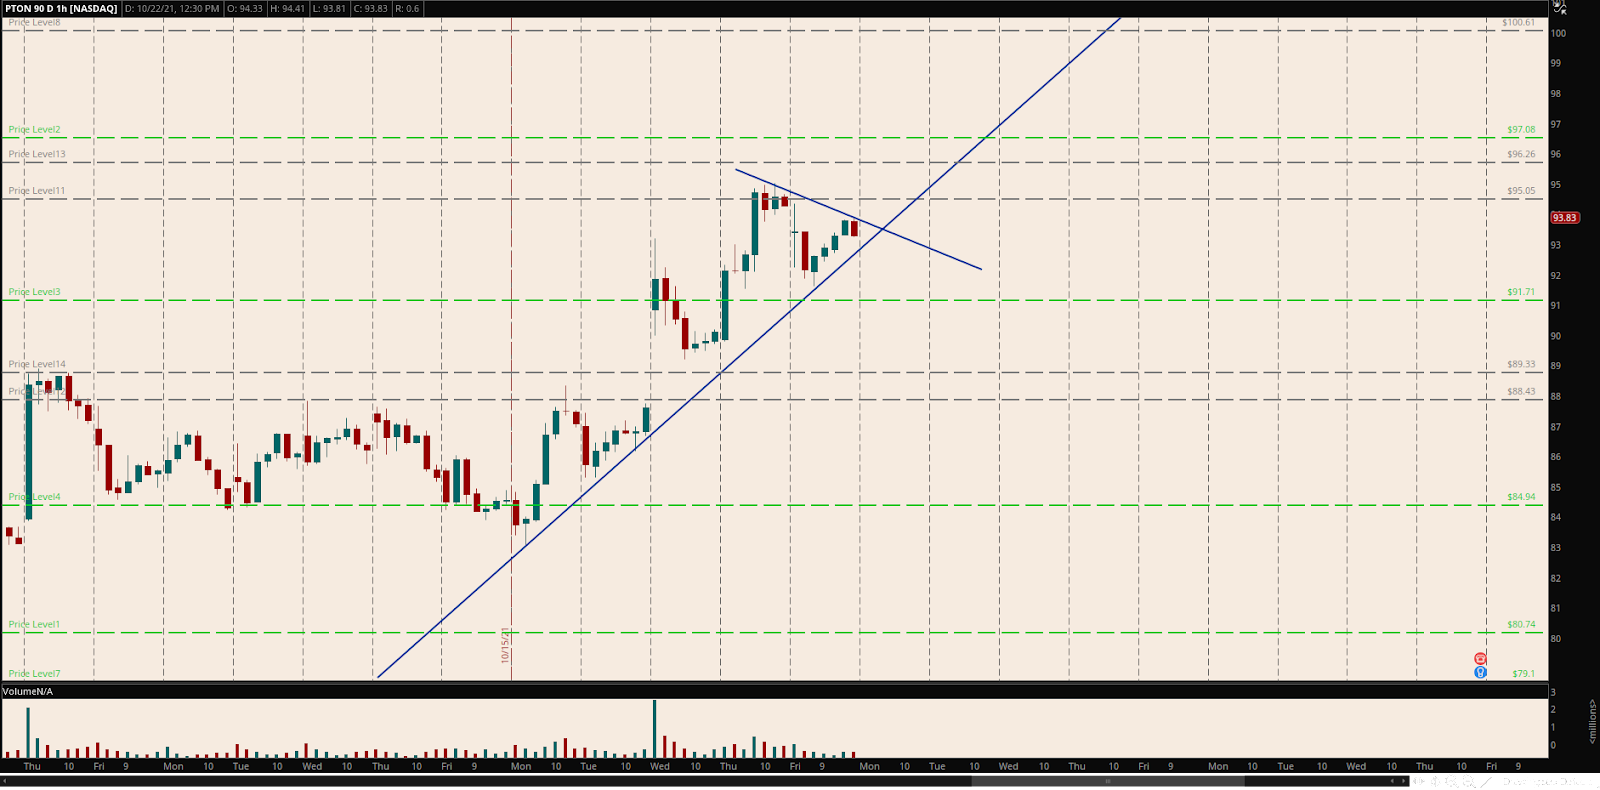
🔫 The Trigger: 95.05
🎲 Milt’s ER Bonus Gamble: SBUX Calls
NOTE: our original choice was HOOD, but given the potential SHIB add tomorrow, they could see an early run-up which leads to a deflation for ER on Tuesday.
IF I played earnings, I’d say that the pumpkin spice cold brew is truly a gift from Heaven.
IF I played earnings, I’d say that their growth in China and favorable reporting last quarter in spite of Covid makes them a tempting option
IF I played earnings, I’d say that flow looks good and the chart could move if it clears 115.
If.
🐳 SBUX: Unusual Whales Alert

🌊 SBUX: Flow reading (2500+)

📈 SBUX: Flow Chart
📊 SBUX: Chart

Pt. 5: Weather: SPY & QQQ Forecast by @daarkmaagician 🌦
Below is the chart & info for a SPY & QQQ forecast from @daarkmaagician, his DISCORD is the place to be (YEETers get two weeks free!).
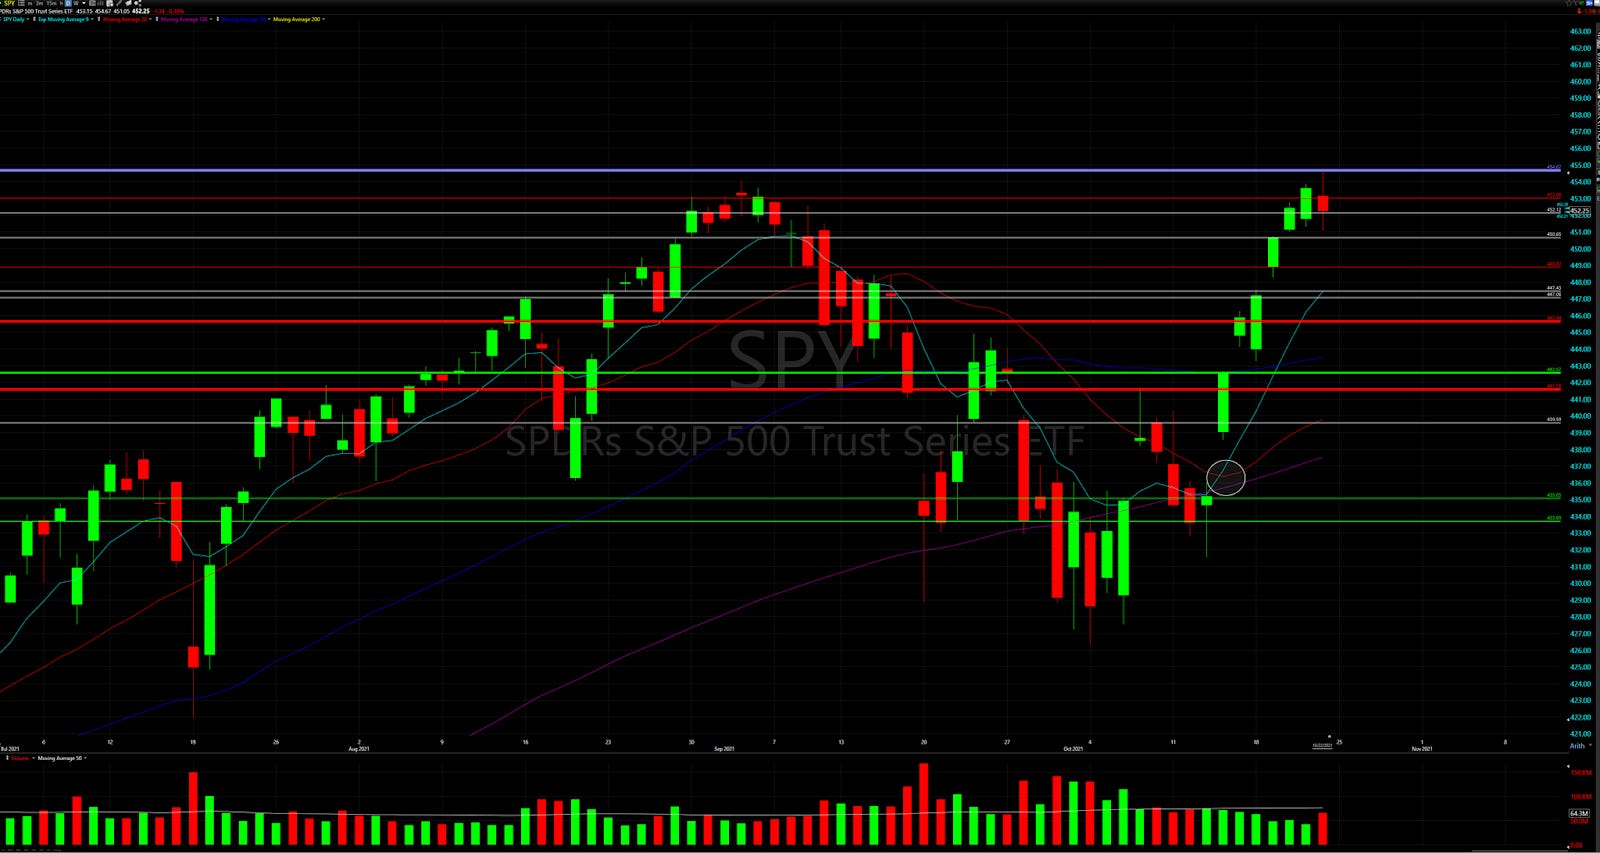
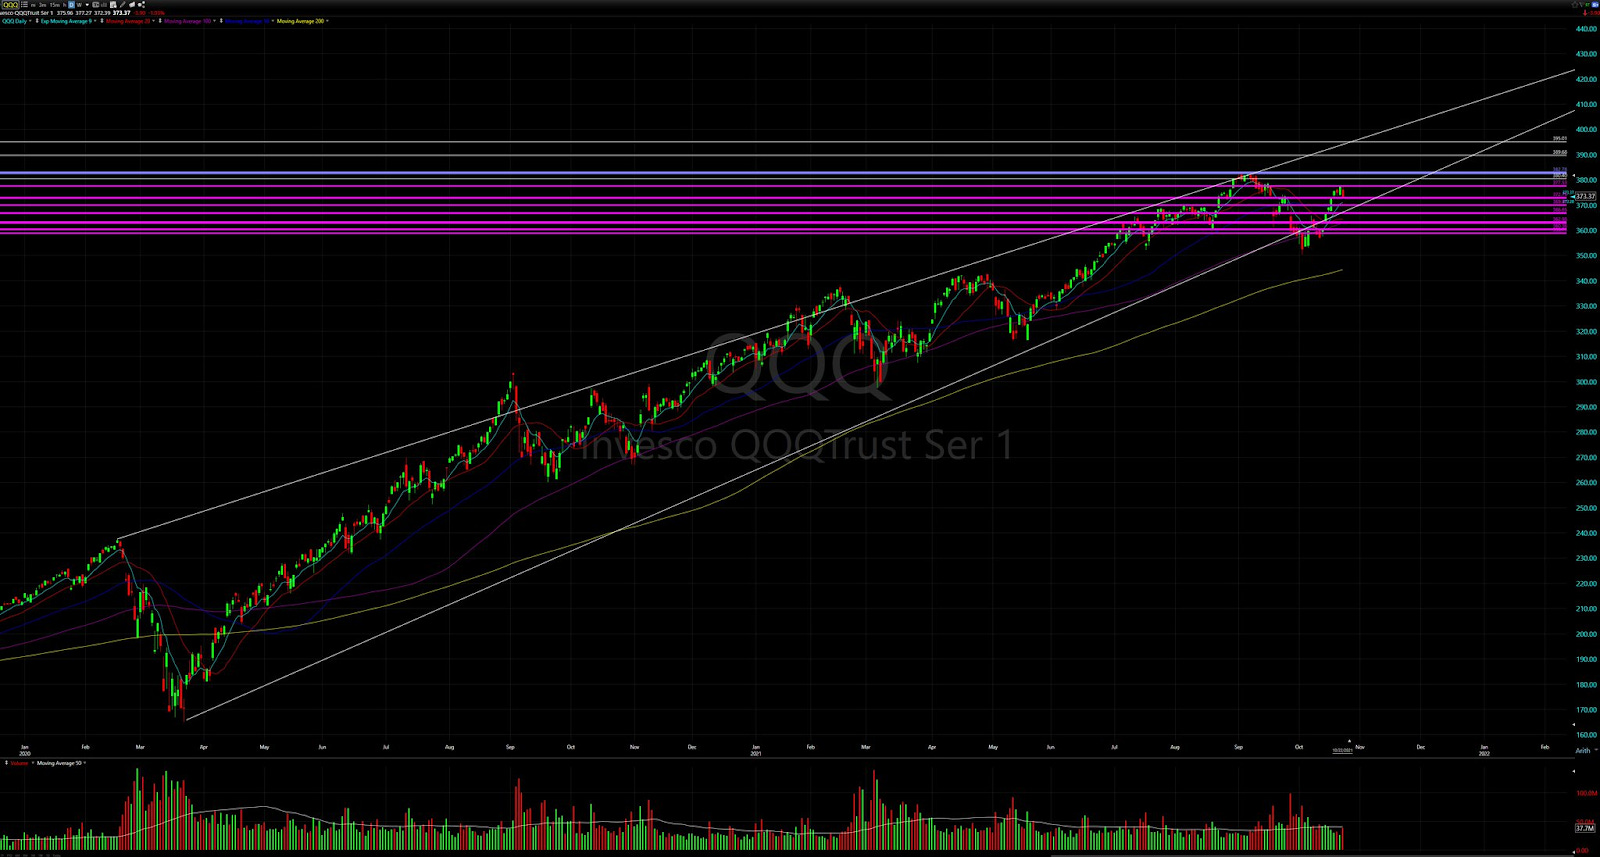
SPY/QQQ Charts Legend:
Solid Blue= ATH, Green= Dark Pool Buys, Red= Dark Pool Sells, Purple= Dark Pools, Orange= Supports/Resistances, Teal= 9ema
SPY Forecast:
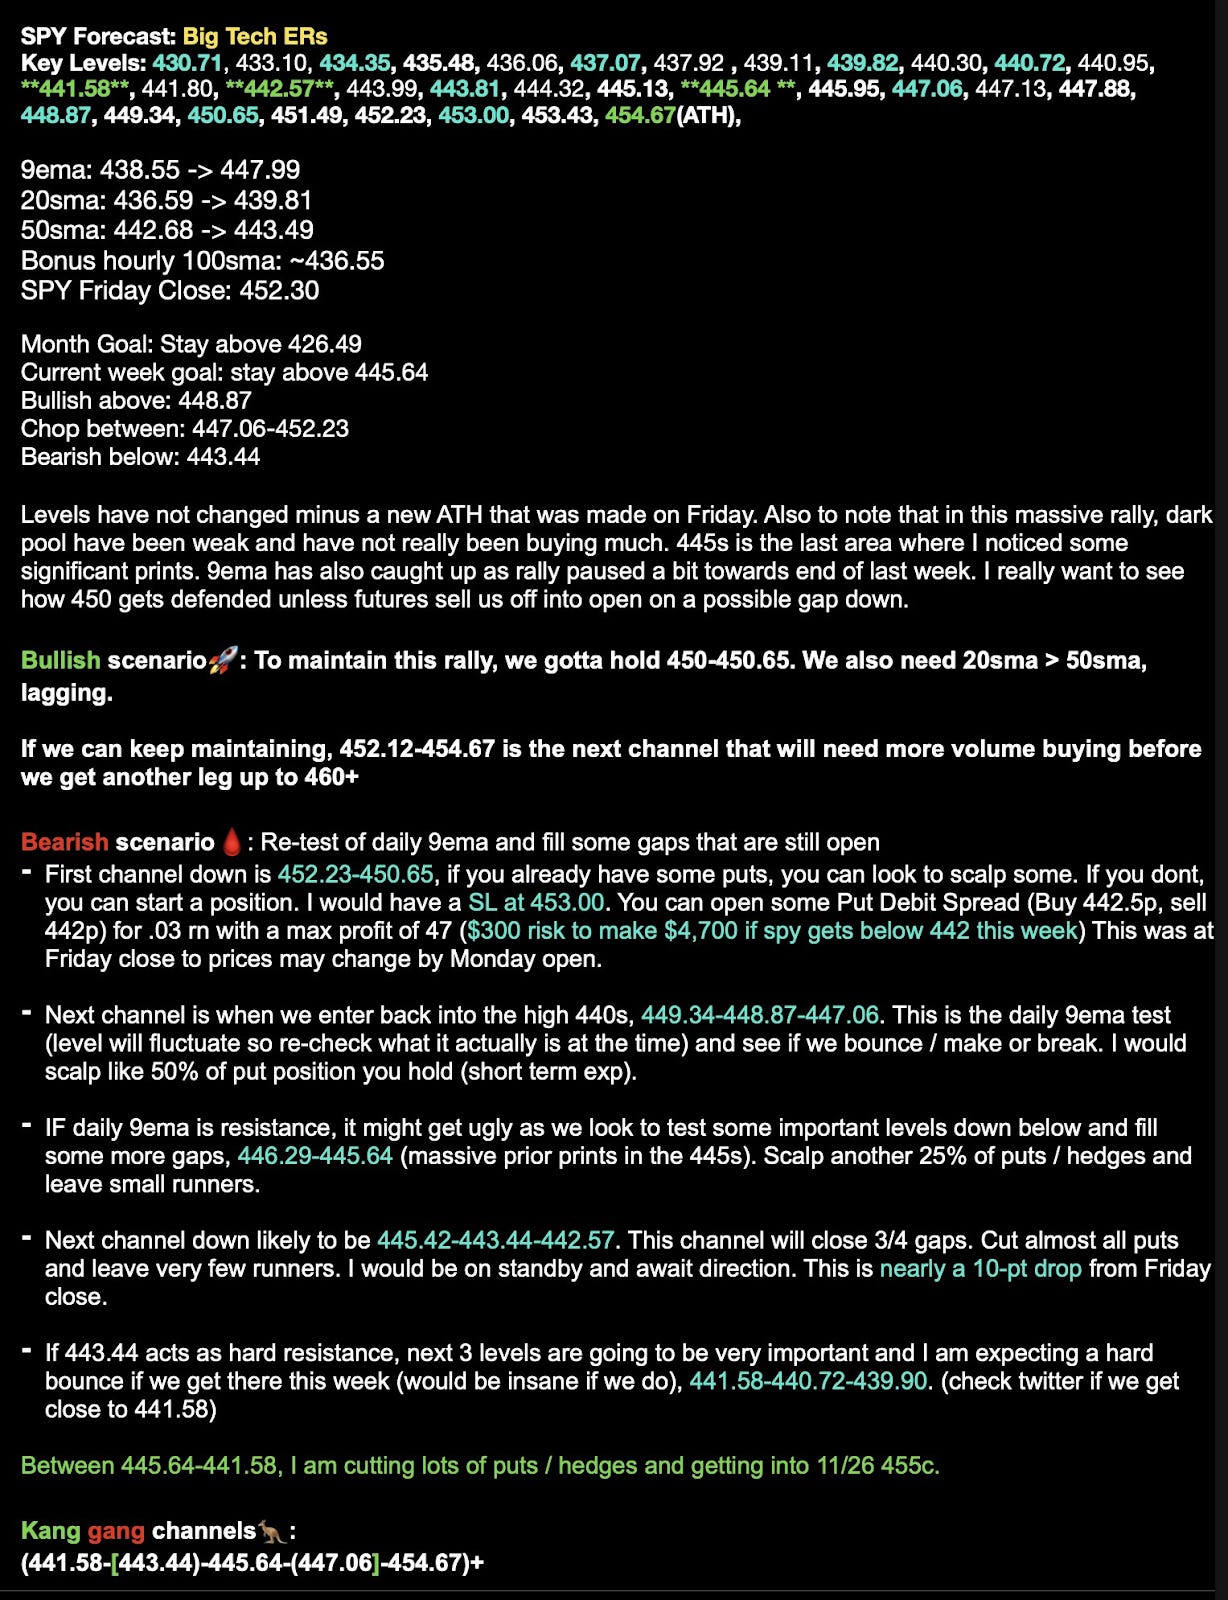
SPY & SPX Charts:
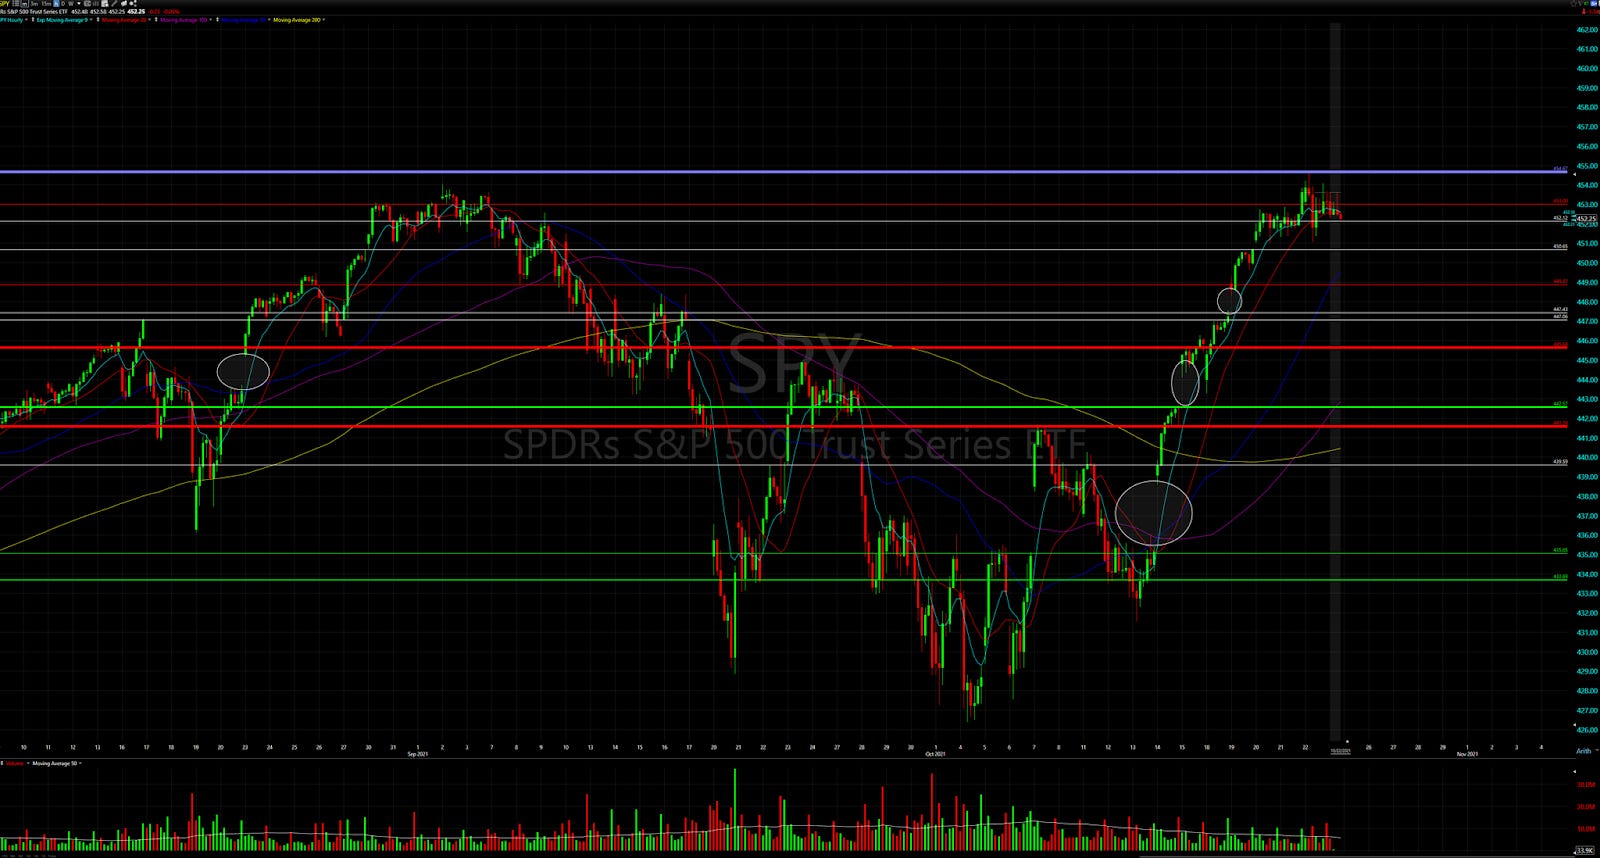

QQQ Forecast:

QQQ Charts:

Make sure you follow @daarkmaagician to get updates on the indexes daily!
Pt. 6: TLDR & GOODBYE ✌️
TLDR:
Pt. 2: Crude Oil DD: Why oil prices are ready to skyrocket
Pt. 3: Crypto DD: How to consistently make money in the crypto currency market
Pt. 4: The Watchlist:
🕵️♂️ Guest Watchlist (@SpyGuyTrading) : PLTR, BABA
🤾♂️ YEET Watchlist: PDD, FDX, CHWY, PTON
🎲 Earnings BONUS: SBUX
Pt. 5: SPY, SPX & QQQ Forecast by @daarkmaagician
Goodbye and thanks for reading! Questions, scoops, comments @yourboymilt or /u/alldatdalton. See you next week! ✌