

🎈YEET no. 28: UP
🎈YEET no. 28: UP
Welcome to The Yeet, a weekly DD where we try to tilt the casino...

Hey! I’m @yourboymilt, and welcome to retail’s Sunday Paper.
I should probably let you know...This is not financial advice! We are here to entertain while giving you ideas, perspective, and angles. Do your own research, I prithee. And if you aren’t subscribed, join us here:
Creator/Editor:@YourBoyMilt The Architect: 🧠 Publishing Associate:@YourGirlRachie
Pt. 1: Week’s Thoughts, Pt. 2: Using Kalshi to Trade Jerome’s Reappointment, Pt. 3: Build-A-Trader (B-A-T) 10: Triggers 102 -Trendlines, Pt. 4: Watchlist, Pt. 5: Index Forecasts (@daarkmaagician ) Pt. 6: TLDR
Editorial Board: @jimengland & @jameoneill
🎈Pt. 1: UP
Sometime in 2020, at the height of the pandemic, we decided to leave grandpa all alone and out in the cold.

Retail was out, tech stocks were in, and if you were talking about the exchange of cash it better have been with Cash App. Gone were the joys of handing a disgruntled cashier a crumpled, sweaty fistful of bills in the new world—we became slaves to the swipe and eventually to the tap—if we dared to make a purchase not seated in front of the computer. A new generation of traders, barely old enough to vote, cemented that tech trend; they brought surging values and profits during earnings reports for whatever screen-based companies they used most. They used the products and then they bought the contracts, entering the options arena even if they were a little less than experienced.
That was then and this is now—well, at least it was now. We’ve spent much of the last year watching “boomer stocks” slowly come back to life, aided by an easing of pandemic restrictions and a toppiness of the tippy top across most tech stocks (remember when ZM was trading for $400? L.O.L.). As the SQs had fallen and margin came calling, sectors like energy grabbed their Werther’s Originals and shuffled back to respectability in their walkers. Airlines roared back as TSA screenings went up, and even the shitstock of all shitstocks—BA—started showing signs of life. Although, to be fair, that momentum change didn’t stop some of the older crowd from joining in the speculation.

Well, surprise! It was just another massive, unending sector rotation!
Back and forth we swung through 2021. Delta caused a see-saw of varying market priorities, but it seemed recently that tech was back on track and in the driver’s seat. If you have any doubt about the return of speculative growth stocks against the “boomer stocks”, look no further than Rivian soaking up market share from car companies decades older than them during their massive IPO this week.

Then, it happened, an unexpected but still devastating bomb—inflation numbers came in for October this week and hot damn…bull r fuk. It wasn’t just that CPI numbers overshot the estimated .6 increase target...it was how badly they overshot the target, landing at .9, that was such a blow to the bulls. This means that no matter what The Fed says, the reality is clear that inflation will run above the target for some time. Betting markets even began to increase the odds of MORE Fed rate hikes coming sooner in 2022.
So now our fate is back in the hands of the discarded, the maligned, and the under-appreciated—the boomer stocks. How? With inflation having shown itself to beat expectations, all market participants are looking for signs of just how crazy things have gotten before conceding that this is, in fact, the top. What’s the barometer? The slew of chain-store retailers that are reporting earnings this week. Why? Because their reports will give a solid indication as to what consumer sentiment has been for the quarter, and therefore just how concerned we should be about the price increasing effects of inflation.
“Walmart is a pretty big barometer for the health of the consumer for sure, and it will be interesting to see how they handle margins,” National Securities chief market strategist Art Hogan said. Rising costs have been pressuring companies across industries, and many have raised prices in response.
Based on the latest sentiment data Friday, consumers are getting worried about rising prices. The University of Michigan’ consumer sentiment index dropped to a 10-year low of 66.8 in the preliminary November report, from 71.7 in October.
In other words, nobody gives a damn what Jerome says about inflation—the word “Transitory” has officially become synonymous with the phrase “I am bullshitting you”. Markets are now accepting this out of control situation to be a given. The bigger focus now is trying to figure out if we can stop the bleeding without a rate hike, or if our growth run through all time highs is set to flatline. Analysts are waiting with bated breath to assess the damage that the Fed’s dovish policy has done to the average consumer during ERs this coming week, and the amount of 7 dollar V-necks Chad bought at Target will now determine the future of the SPY.
For so long blue chip stocks—the BAs and the KOs and the Ms—were what held our market afloat. For decades investing was a patience game, and the most reliable of long-term stocks were the vehicle to the American Dream. Then, a sea of speculation came with a virus that ravaged the world; words like “reliable” became synonymous with a “disappointing” 15% annual return, and “blue chip” became market speak for “boomer”. Now that tech’s speculative fervor may have overheated, it’s the old, boring tickers that will show us the way. Retail earnings this week will, for the first time in two years, represent the dog wagging the tail rather than the other way around; retail numbers are driven by the shopping habits of the ordinary person, meaning that the economy is finally driving the market. Investors this coming week will look at how the average Jane spends her money—and therefore her life—to determine if our Roaring 20’s are over. Too bad, it’s just when I started to get the hang of this “trading tech for profits” thing.
We’ve been doom and gloom for months, sure, but this time—and with inflation running this hot—growth may finally be approaching the sunset. If we somehow survive this week’s reports and our hot air balloon floats to all time highs, maybe you’ll take a little bit of your profit and put it somewhere safe. Somewhere like those same Blue Chip stocks that we let die alone, while we attended the greatest speculative party of a lifetime.
It will always be our greatest adventure.
Welcome to YEET no. 28, brought to you by the older and wiser Granpappy Milt
🍀 Pt. 2: To Jay or not to Jay: Using Kalshi to Trade On Powell's Reappointment Odds (and other stuff)
When we needed a hero? Papa Powell was there. And when your account was at zero? Papa Powell was there. And now? Our man could potentially be discarded by the Biden administration, tossed behind us after the liquidity party he hosted like so much confetti. There are two parts of the Swan Song of Jerome Powell that are interesting to the YEET:
1) How a man could go from being a shoe-in for reappointment to a roll-of-the-dice so quickly, and
2) How you can potentially make a bagger on it using Kalshi.
I’ve been following this story since YEET 18, which was about the trials and tribulations of Jerome before his many recent “you done fukt up” moments. Although it seemed a given he would be reappointed back then, the road ahead since has been turbulent as hell (see: insider trading running amok at The Fed). I’ve been tracking the odds on his re-appointment—because I am hopelessly addicted to speculation—and trying to trade against it on Kalshi. For me this app is cool because as you probably have guessed—I look at a shitload of news. If you keep up with current events and have a reasonably educated opinion, this is a dope way to make easy money on it.
Here is how I’ve been able to use their service to see where things went from “Go, Jay!”, to “Oh...Jay.”, to “No Jay?”.
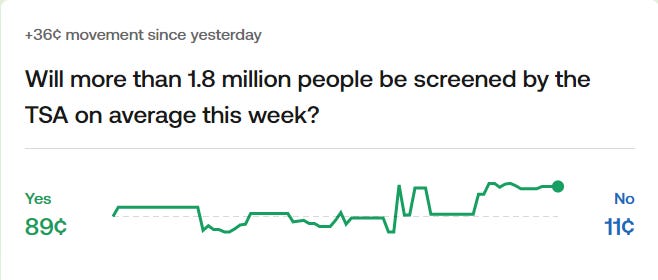
Each of the bumps in price since the event opened on the marketplace represents an increase or decrease in contract price based on the probability of his reappointment. Keep in mind these trade like options contracts, and the “Yes” contract for his being replaced has fluctuated from .15 to .32 a contract (~110%).
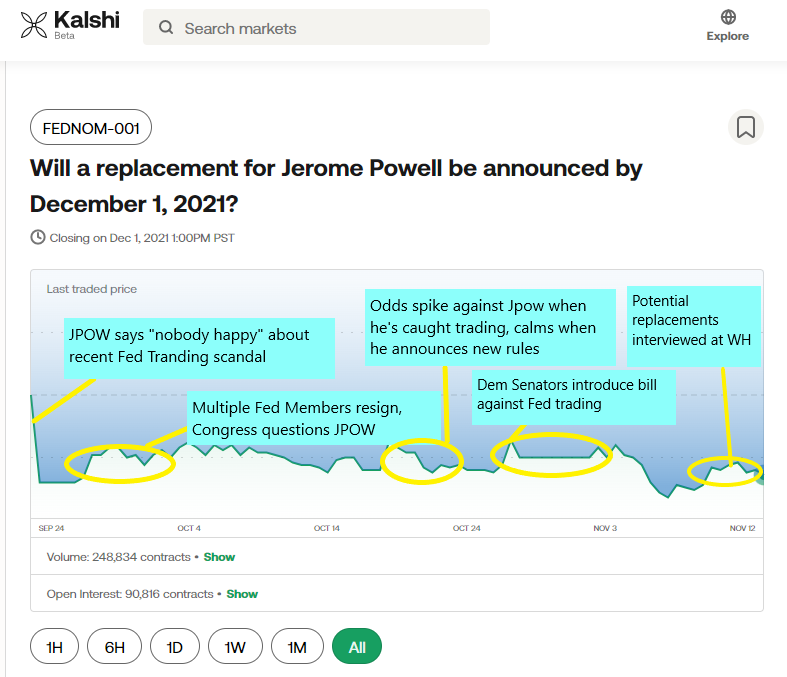
Obviously, the best time to buy YES contracts—or trading that Powell will be replaced—would’ve been in the midst of all the drama surrounding Kaplan and Rosengren’s shady trading. But, if you’re on the late train like me, the way that probably makes the most sense is following the news pops like they’re essentially IV—your goal is to enter your trade before speculative news hits the market in either direction you want, riding probability up or down through news momentum. The rises and falls in the graphic above can be traded like an options play—the price you pay for each contract on Kalshi correlates to the probability of the outcome. So, if a story is broken on Brainard (his potential replacement) receiving increased support amongst Democratic lawmakers, for example, the probability that Powell is replaced goes up and so does the value of your “Yes” contracts.
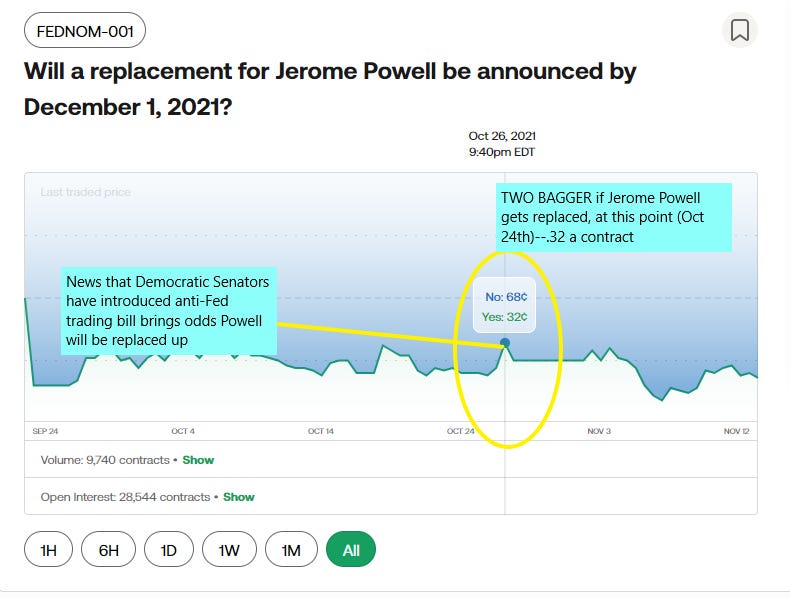
At the referenced point in the timeline above, where the Dems introduced the anti-Fed trading bill, the price on the “Yes ” vote was relatively high at .32. If you were to hold that Yes contract until the end, and Powell did get replaced, congratulations—you’ve got yourself a multibagger! Once the news from that Democratic bill settled down and it appeared that Jerome was a shoe-in again, the contract against Jerome’s reappointment became .20; yes, a 4 bagger if you bought your contract this week and it expired in your favor:

So this all begs the question...what is the right trade move on Kalsh for this? Will Powell be reappointed or not? There are a few factors affecting this outcome—some of them are obvious, but some of them may give a sneaky little edge to the “Yes” vote for replacement if you’re chasing that 3 bagger on Kalshi.
The Fed Trading Scandal: This is actually a big deal that seems to somehow get worse every week. After Kaplan and Rosengren decided insider information meant it was cool to YOLO SPY calls like a WSBer, Pow’s leadership was called into question (much like Lebron’s after destroying my Lakers this season). Even if this was able to be overlooked, it was compounded by issues with Powell’s own trading weeks later. From Bloomberg:
Powell sold a stock index fund worth between $1 million and $5 million last October. The transaction was outside the Fed’s blackout period and months after the Fed had set its pandemic monetary policy. Some progressives have drawn attention to the trades to build the case for Brainard to replace Powell.
Gotta keep your hands out the cookie jar, Jerome!
Biden biding his time: I know Biden is so old he’s got a picture of Moses in his yearbook, but he’s moving even slower than Warren Buffet in slippers on this decision. This wait—which is the longest wait for a Fed chair reappointment in the modern era—has plenty of people wondering if it’s a sign of damning uncertainty.
For months, economists and investors alike have anticipated that Joe Biden would tap Powell for another term — reestablishing a tradition of a first-term president sticking with the predecessor’s Fed chief. But the amount of time it’s taking Biden, along with speculation he could be replaced by board member Lael Brainard, has seen doubts creep in.
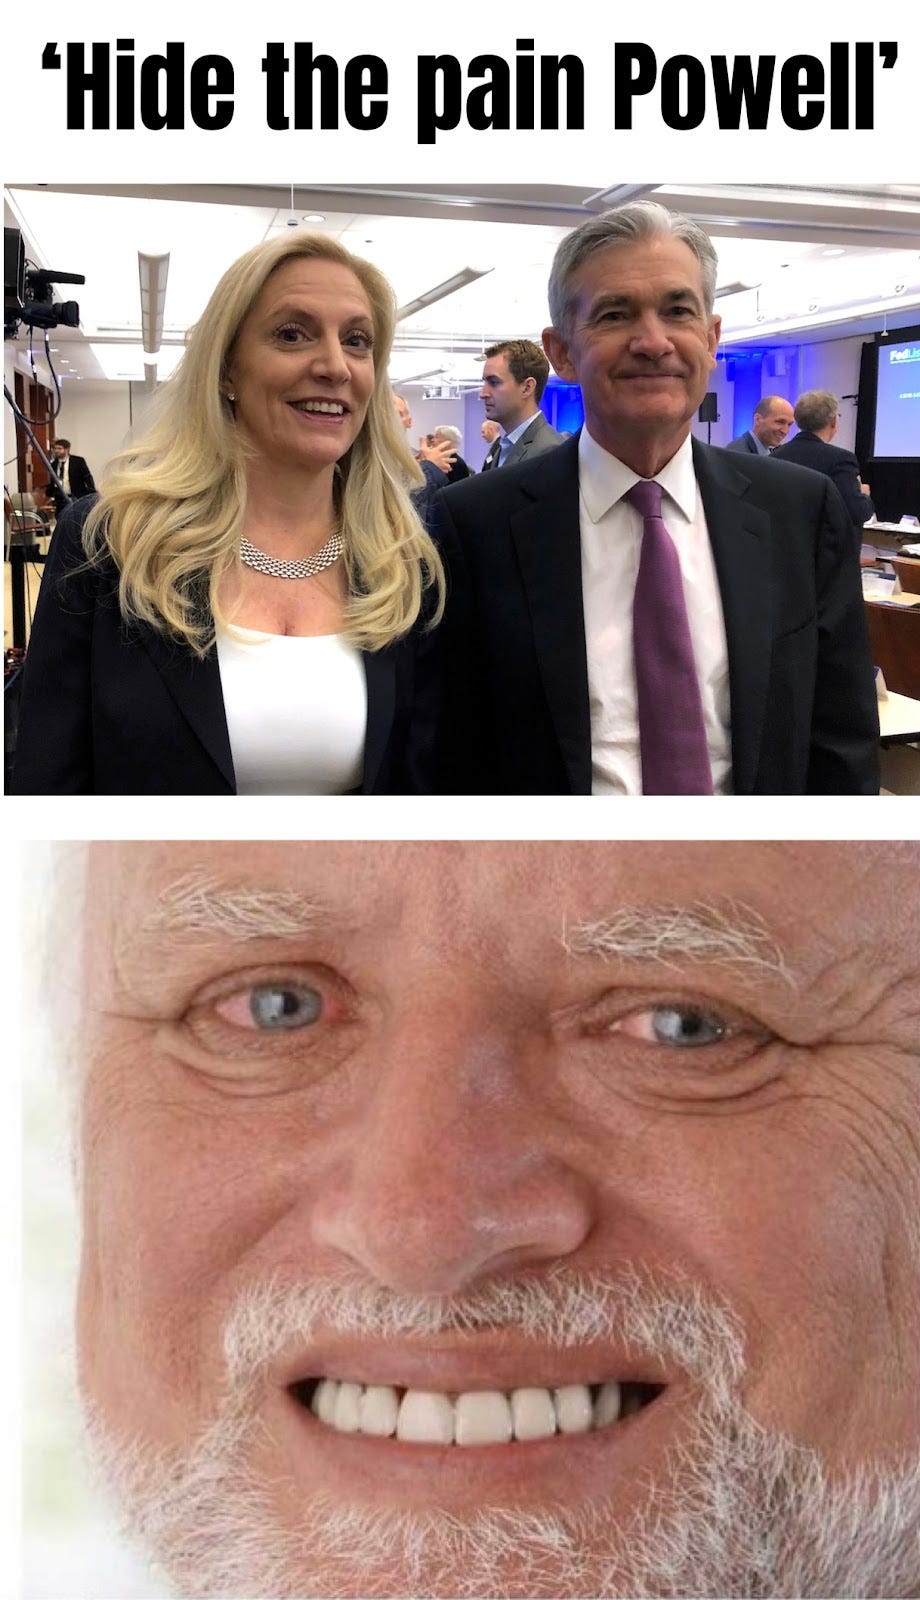
The Ringer: Lael Brainard is seen as a logical replacement due largely to political reasons; she’s an Obama appointee and she’s a champion of the administration’s stated core values like climate change and racial equality. What she means most to you, the YOLOer, is the ability to BUY TECH CALLS FOREVERMORE. She’s dovish as hell—even more than Jerome (yes it’s possible)—and as a result treasury yields will respond accordingly. We got a preview when she visited the White House for her interview:
Treasury yields sank following the report as investors debated whether Brainard — generally seen as more dovish on monetary policy than Powell — would follow through on the Fed’s latest asset-purchase tapering timeline or hold off on raising interest rates for a longer period than currently anticipated.
I never, ever thought I’d say this, but...it looks like the best thing for your calls could be Powell getting ousted. What a time to be alive.
Do I necessarily think that Jerome won’t be reappointed? No. We owe him for the pandemic market recovery, and Democrat or Republican that’s something that Biden won’t forget. What I do think, however, is that there are potential issues that make current pricing on Kalshi mispriced for the odds of a “Yes” on his reappointment. That’s where flipping your contracts like options comes in—you do this when you think you can take advantage of a wrongly-priced sentiment in the short-to-medium term. For example:
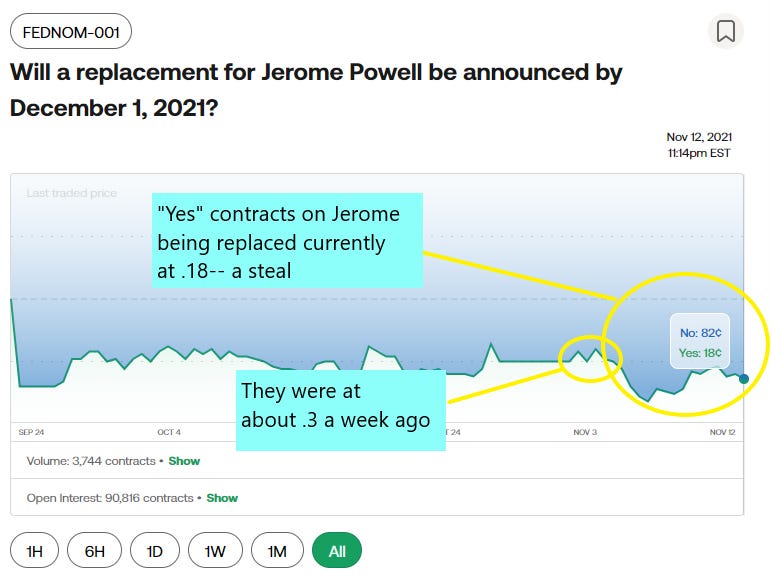
With news that affects Powell’s chances of being reappointed coming out every day, there are possibilities for easily profitable fluctuation in the prices of these contracts. As you can see above, just a week ago it cost .3 for a “Yes” contract , and now it’s .18 for a “Yes” contract. If any upcoming news were to break against Powell’s appointment, and the probability increased and returned your contract to the price just a week ago, you’d be looking at a 40% increase in the value of your contract. Not a bad little chunk of change for simply following a news story and reacting accordingly.
So we’ve given you a lot of information on both Powell and Kalshi—here it is condensed so you know what you’re doing and don’t blame me when you put your life savings on the wrong trade.
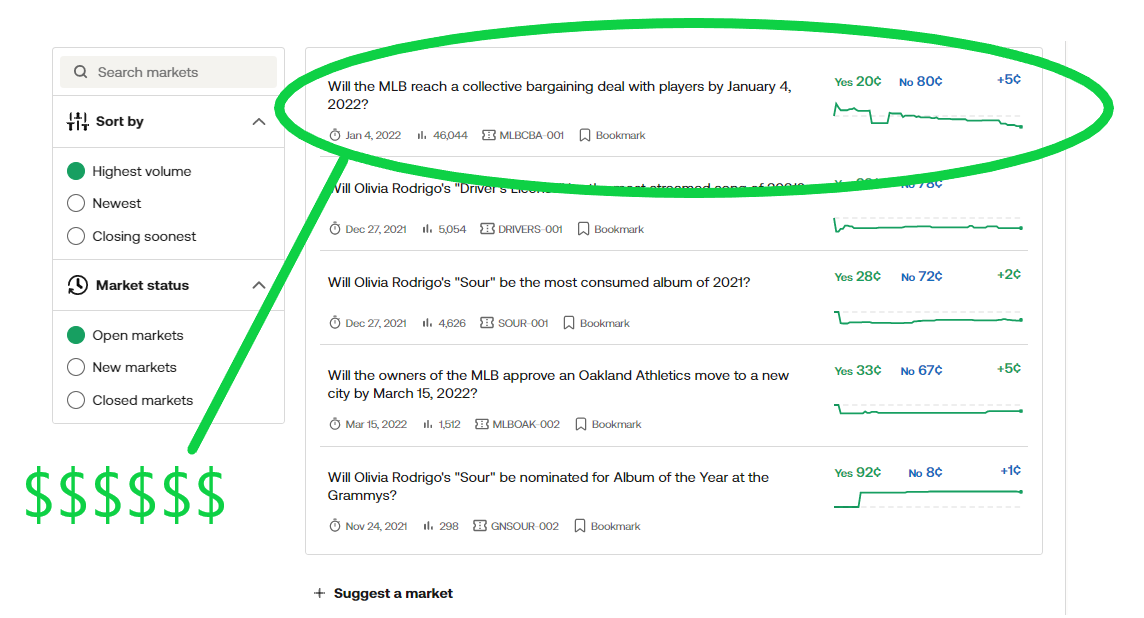
Figure out which event you’re interested in of the options Kalshi has

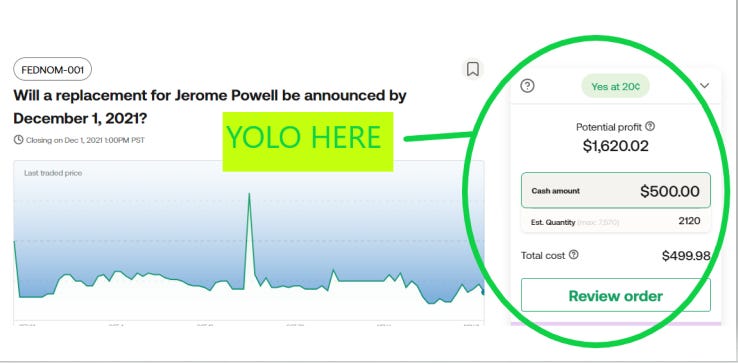
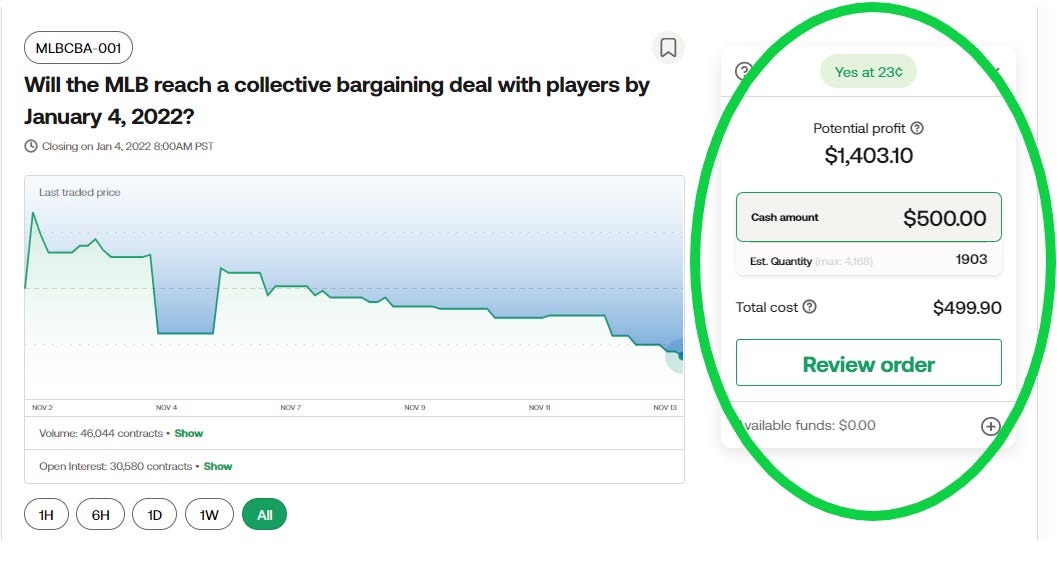
Buy your contract: there will be the option of a “Yes” or “No”, and when you enter your trade amount it’ll show you the potential profit on your contract held until expiration based on current probability.
Hold until expiration or sell early: think of this as just like an options contract. You can either hold it until it’s been settled by the result (this is where the multi-baggers are made), or close it when your contract rises for a nice gain based on increases or decreases in probability.
NOTE: What’s great is that when these contracts move, they MOVE. It’s super easy to get double digit wins in a day or two if you’re following an event closely. If you want to play it safe for a guaranteed profit, another cool thing is that Kalshi functions as a kind of “bond market”—some contracts have such great odds that they are nearly guaranteed profit. If an event is above 80% probability, it’s considered a stone cold lock.
If you’re entering the Powell trade with me and want to play along, my strategy is simple—I’m picking up on the YES vote and seeing if I can get a quick sell for 5-20% profit while the contract is at a low right now. This is just a speculative play of mine—I’m also adding several of those 80% shoe-ins to build up my account.
I like to take advantage of “mispricings”—or contracts where I see an advantage/error in the price in relation to probability—so I’ll be posting some of those on my Twitter and in The YEET Watchlist. It takes a day or two for funds to clear on deposit, and about the same to withdraw. In other words, you’ve got time to join me on this one.
Hopefully Powell doesn’t add to his regulation woes by trading against himself on Kalshi! Good luck!
🦇 Pt. 3: Build-A-Trader (B-A-T) 10: Triggers 102 - Trendlines
Welcome to Triggers part 2 BANG BANG! 🔫🔫
Okay, so last week in Triggers 101 we had you start out with the basics: creating your weekly and daily support and resistance lines. We preached precision, for the trigger method is one of great care; we are nude—meaning we don’t use any indicators with this form of trading—so every line must be crisp. You’ve gotta look close; when it’s time for me to start creating my levels I’m hunched all up on the screen swaggin’ like Quasimodo.

🔫 Triggers 101 Quick Review
We taught you about how to—and the importance of—creating your weekly and daily support and resistance lines, dating as far back as you have the patience to. In our SNAP example we went from this:
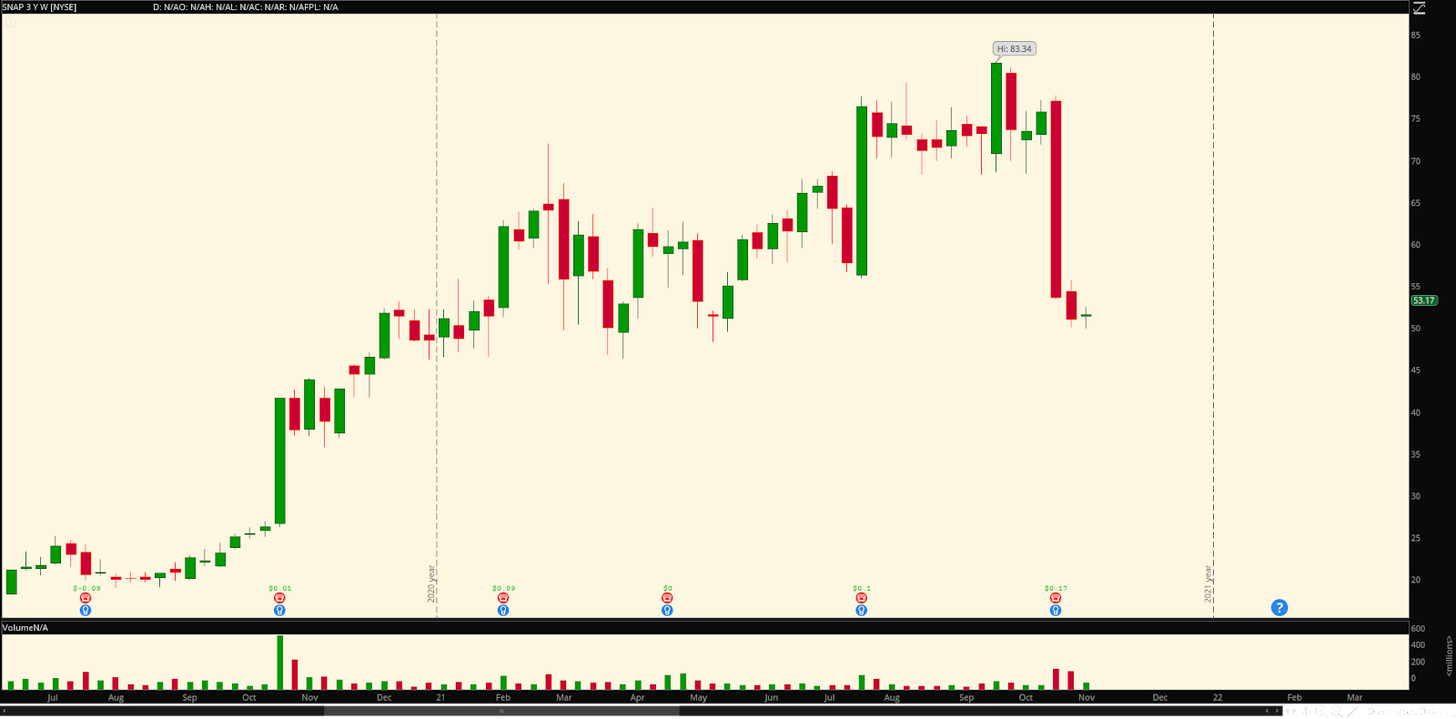
To this:
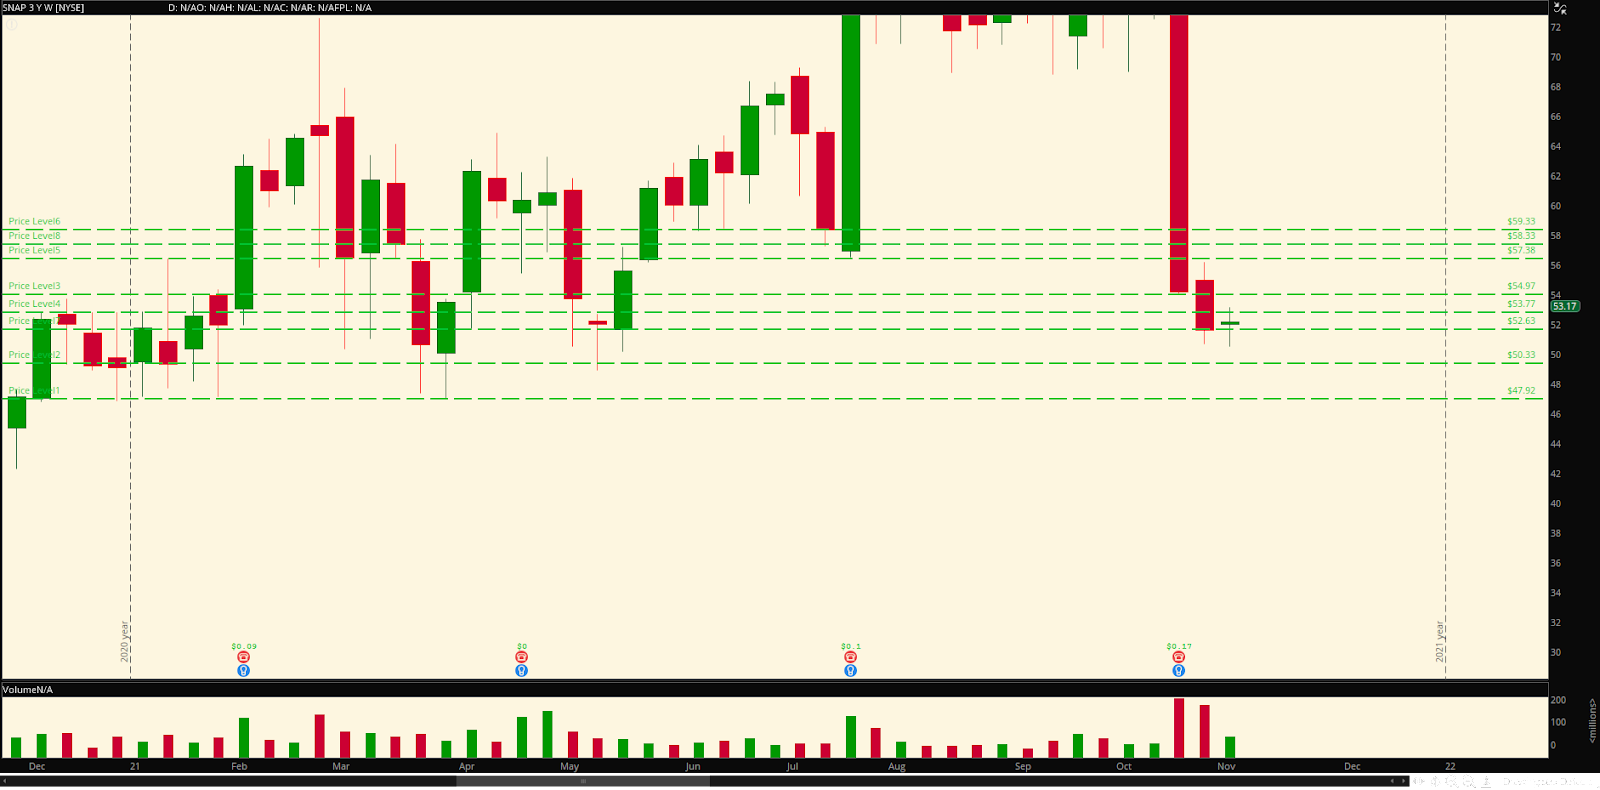
To this:

🔑 Key lessons were:
First, create your WEEKLY support and resistance lines (at candle reversals), and color code it something you can live with for a long time! (Mine are green. I regret it every day.)
Create your daily support and resistance lines in a different color
Homework was to complete this process for 10-20 tickers so you get much, much faster at it. I hope you did that. If you already are quick with charting, though, kudos to you!
That’s it, lol. We are going VERY slow because this is a VERY meticulous process.
📈 Today’s Lesson: Trendlines
So, you’ve got your support and resistance lines, and you want to know how to figure out trends specifically applicable to the trigger model? We’ll break this down into steps for you, and be glad—once you have this down you are very nearly ready to create your own trigguhs. The trendlines will help us determine the directionality of the price action, and will eventually relate to what levels we’re eyeing for breakouts, gap fills, etc—all the good shit you see FURUs tweeting about (with varying levels of credibility).
☝️Explained simply: these trendlines explain whether the stock is heading in a direction that is uppies or downies. Not necessarily, but by next lesson, you will understand how this trend price action combines with support and resistance to create triggers.
This is still an important lesson even if you know about creating trendlines already because of the method we use; think of it like Russian nesting dolls—we start wide and keep narrowing things down in specific ways.
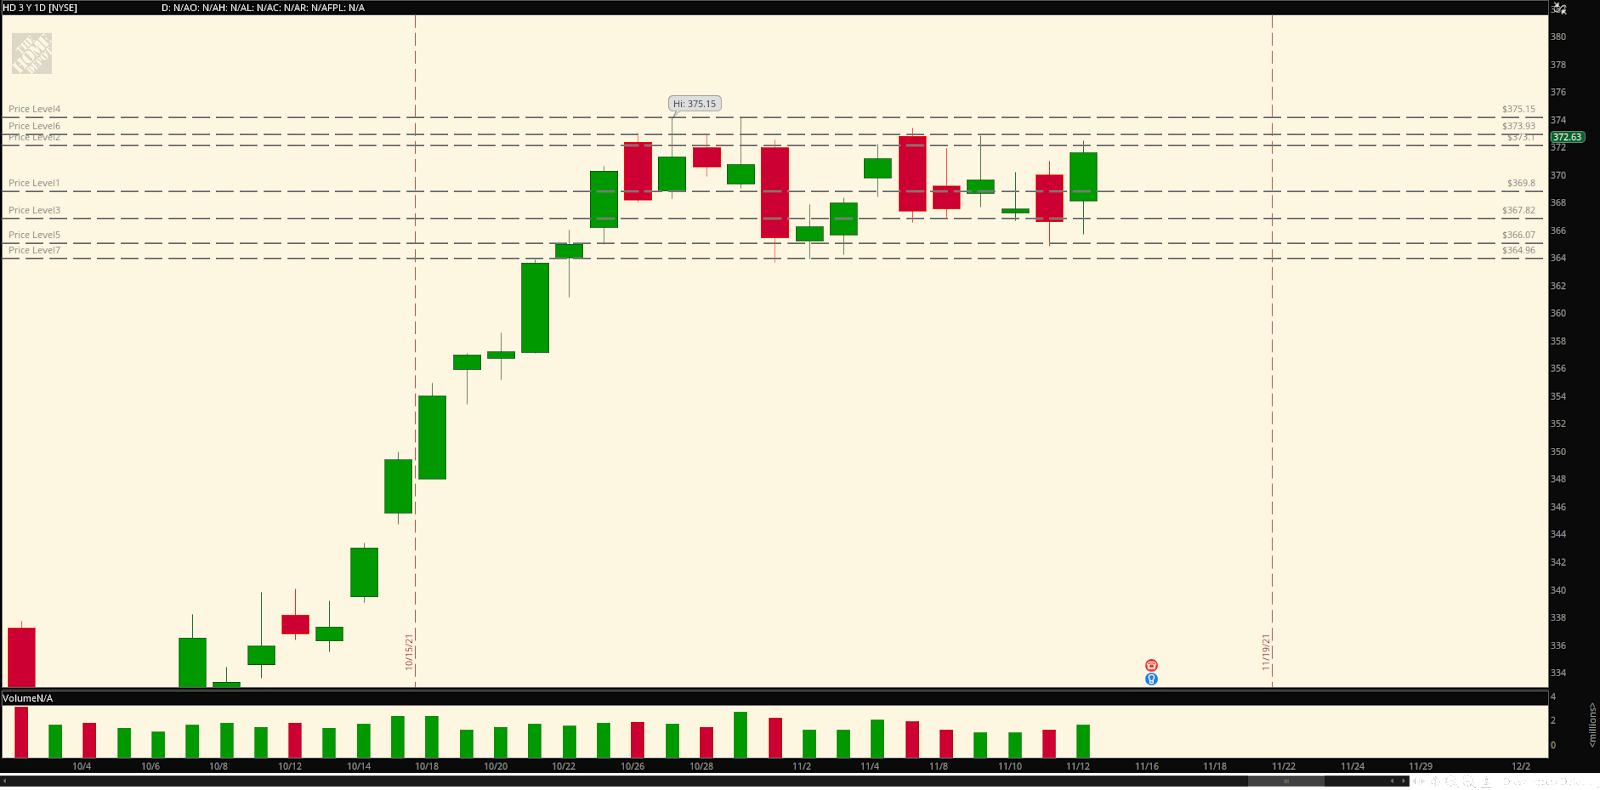
Creating trendlines: HD Example
1⃣ Step 1: Look at your chart on the weekly interval to see if there are any trends to stand out to you. Sometimes there are, sometimes there aren’t.
❗️NOTE: the longer your intervals, the STRONGER the trend. If you spot a pattern on the weekly it has a higher chance of playing out than one on the hourly, for example.
With HD here is the weekly, 🤭 nude:

I am going to fast forward through the support and resistance lines, since you learned how to do this last week. See you in a minute when you’re done... ⏲
🥳️ Okay, now that you’re back, you’ll notice there were no weekly levels; the HD chart ONLY had daily support and resistance near the price action, and it was sparse. I purposefully chose this so you can see the immediate chart is not ALWAYS cluttered and full of levels, nor does it necessarily have to be for this work.
So, now that we have our s/r levels, let’s start working to find our trends. Head back out to the weekly timeframe, my friend.
Trendline explainer/refresher: in B-A-T 5: Spotting Trends we went over trendlines, where we told you the key was to find the two high points at the top of a direction of candles, and/or the two lowest points at the bottom. Check out YEET no. 14: Gotham to get more details on that. You’re spotting directionality up or down, to put it simply; you’re looking for candle wicks on the top slope that go from high to low, and on the bottom slope that go from low to high.
2⃣ Step 2: HD weekly interval trend spotting
We’re going to focus on the current price action on the right hand side, because that’s the area we care about most. But when you first start, zoom out so that you can spot any long term trends. Hey guys...I think I see something here!
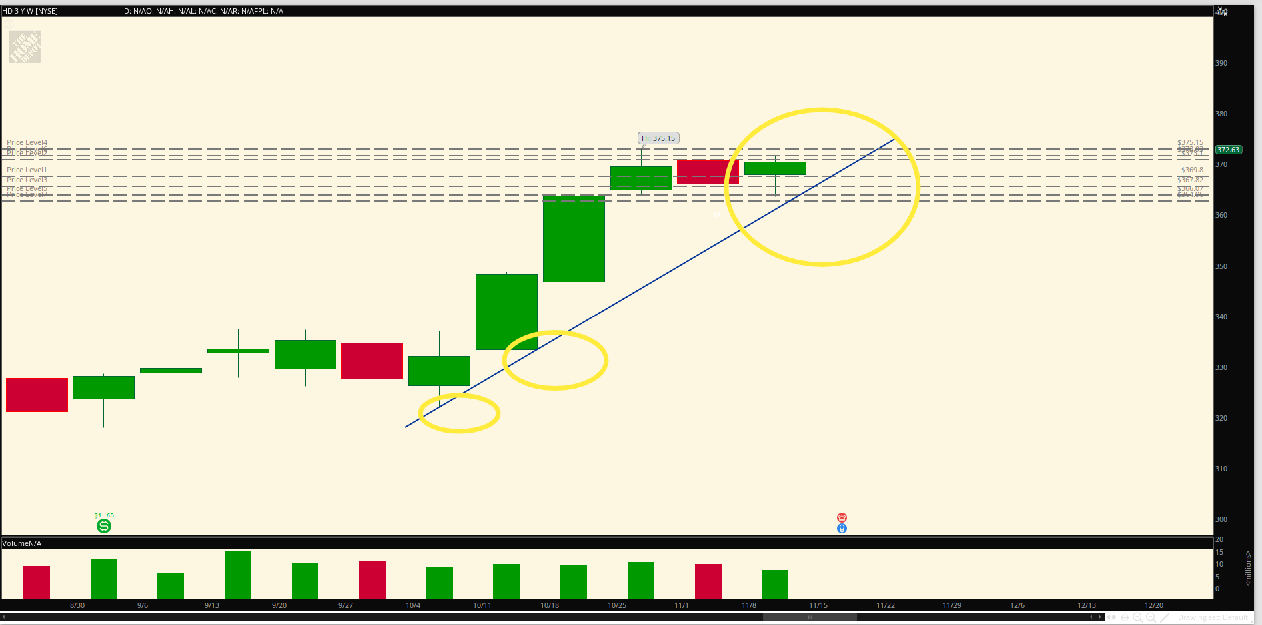
Notice we find three (two touching, the top one kind of implied) candle bottoms headed upward in our bottom trend. If we zoom in on where the price action is, we also see one at the top:
🤨 Note: I know you might be thinking—”Milt wtf? You said be precise and these trend points are slightly loose!” Settle down, please. Your support and resistance lines MUST be crisp, but your trendline can be a slightly (SLIGHTLY) more generalized to gather a pattern—particularly on the longer time frames like the weekly. You’ll see why soon.
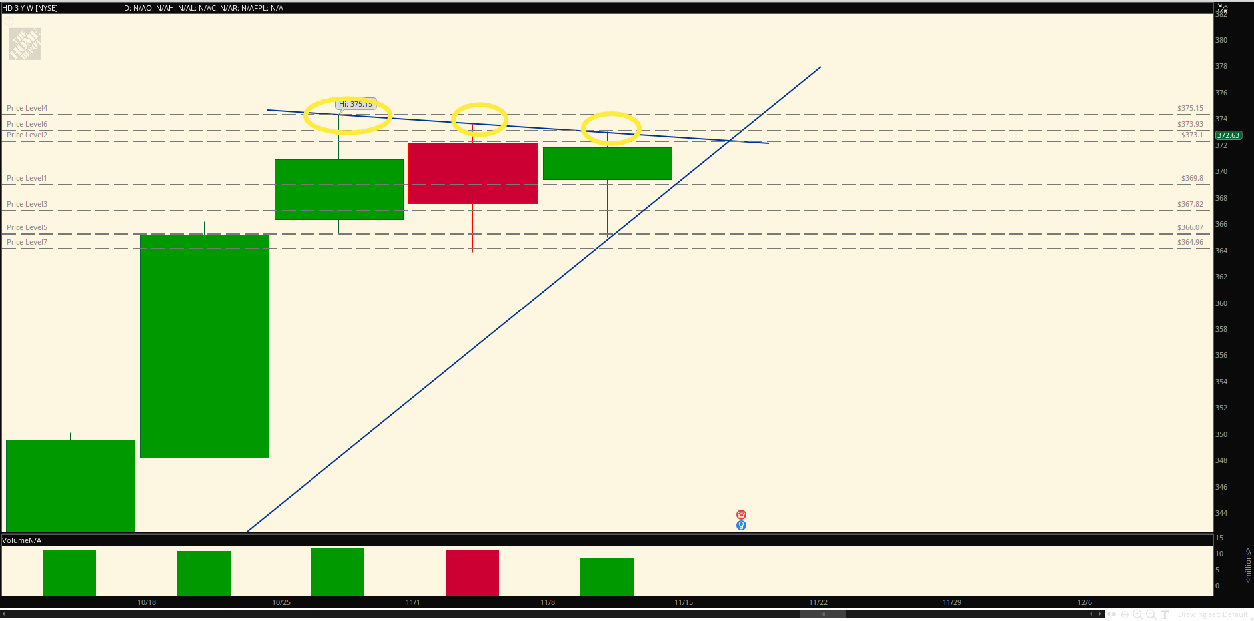
3⃣ Step 3: heading to the daily
You want to next look at the daily, checking for any shorter term trends, or confirming what you see on the weekly. Here’s HD trendspotting on the daily timeframe.
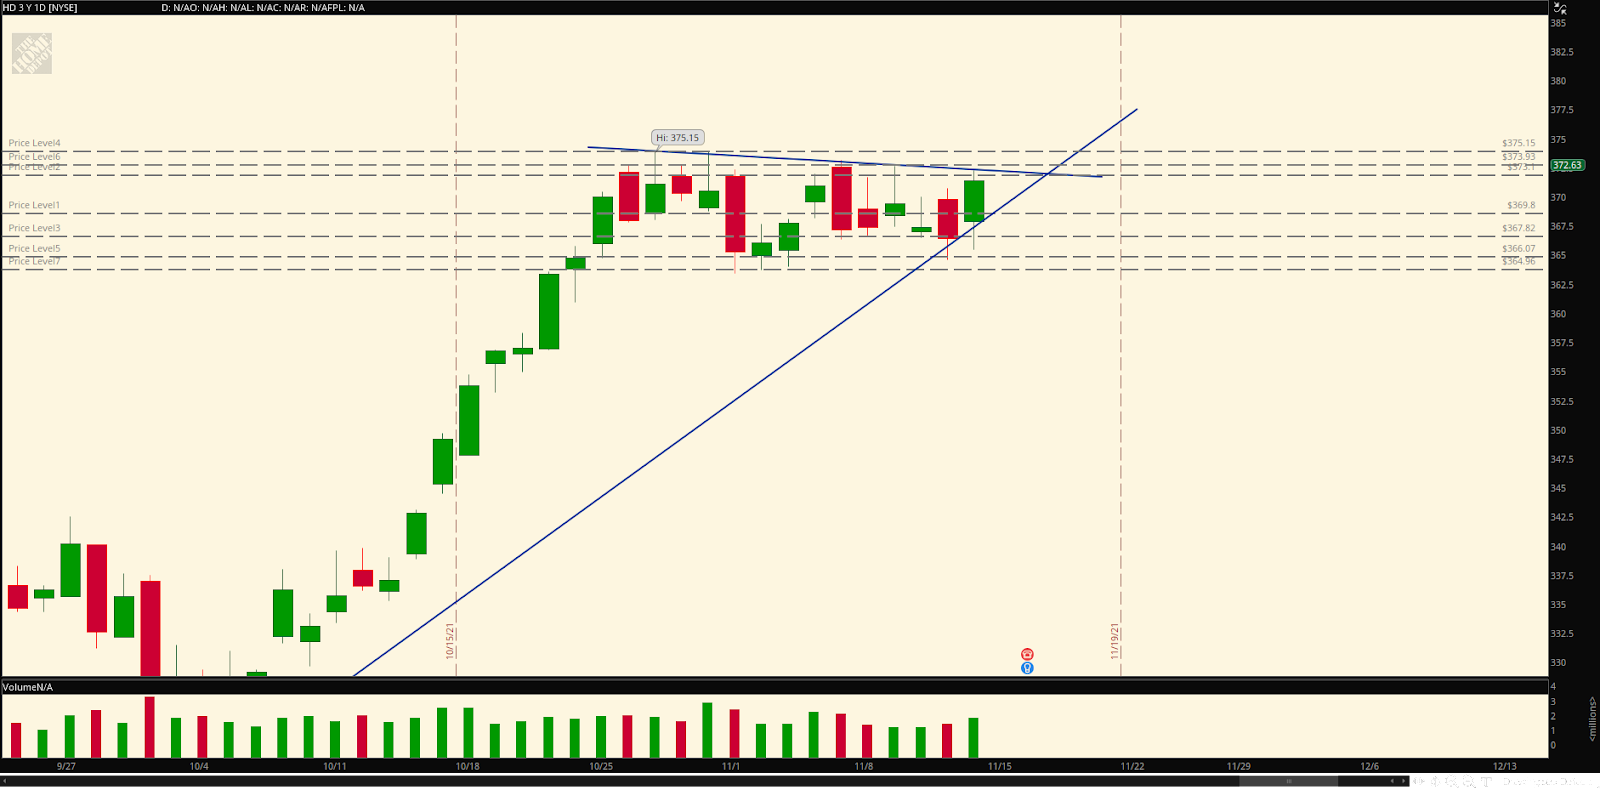
❗️Note: when we head to shorter timeframes we are looking to see if there are trends within the trend. If there are not, like here with HD, we just keep working down in the timeframe.
⭐️ Pattern bonus: Don’t forget, if you read pattern spotting in YEET 16: 30 for 30-Three Nights in March, you know to look for specific patterns for 🐂 bullish or 🐻bearish signals. Here we see what looks to be not only a triangle forming at our price action, but ALSO a bull flag here on the daily! Bullish!
4⃣ Step 4: The Hourly Interval (this is where our bread is buttered)
The hourly interval is where you are going to adjust your trends to fit, and also where the trigger magic happens. Once you’re viewing the hourly, you should notice that the current price action is right near the top weekly trendline. This indicates to us that there is the potential for a breakout of the price action from the weekly trend, which is incredibly bullish. By switching to the hourly timeframe, we’re able to get a real-time view of it breaks it, rather than having to stare at a gigantic, slow-moving weekly candle.
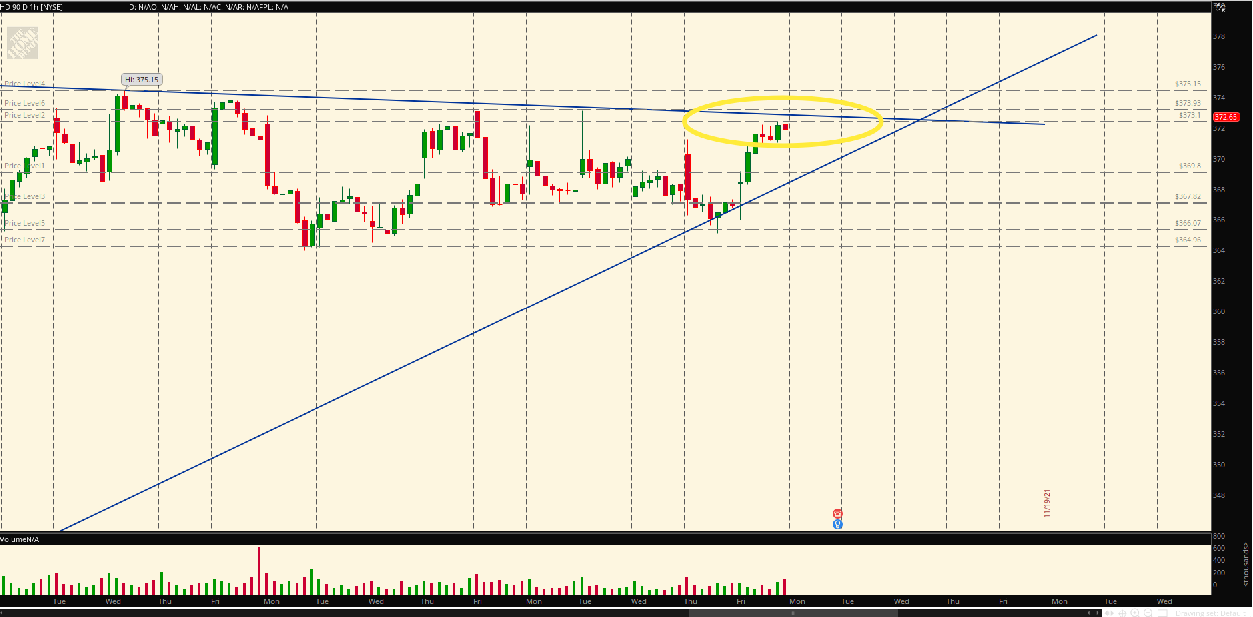
Trends within the trend: Trendception
So you’ve got your long term trends setting the table, but the hourly is also where you find your trends within those larger trends. These are ESPECIALLY important for price action that is nearing a major weekly or daily trend, as we saw with HD in the image above. Here we spot an upward trend taking place within the weekly triangle we’ve identified. We color that differently from our long term trend, so we know it’s a shorter time frame line (shit becomes messy real quick during trading hours if you don’t differentiate, life comes at you fast on the open). I choose red for shorter term trendlines to go within my blue longer term trendlines.
Here in HD we’ll show you an hourly trendline forming within the larger weekly triangle:


👏 So now you have HD with your
Weekly and daily support and resistance levels
Long term trend (in blue) where you found an awesome, long-term pattern
An hourly trend within that longer trend as it approaches the trendline for a possible test/breakout
If you’re trying to look ahead, you might see what’s coming with the trigger and how we are arriving there. For now, before we jump ahead to next week, let’s instead look at some more varied examples.
COST Speed Run: Showing another quick example
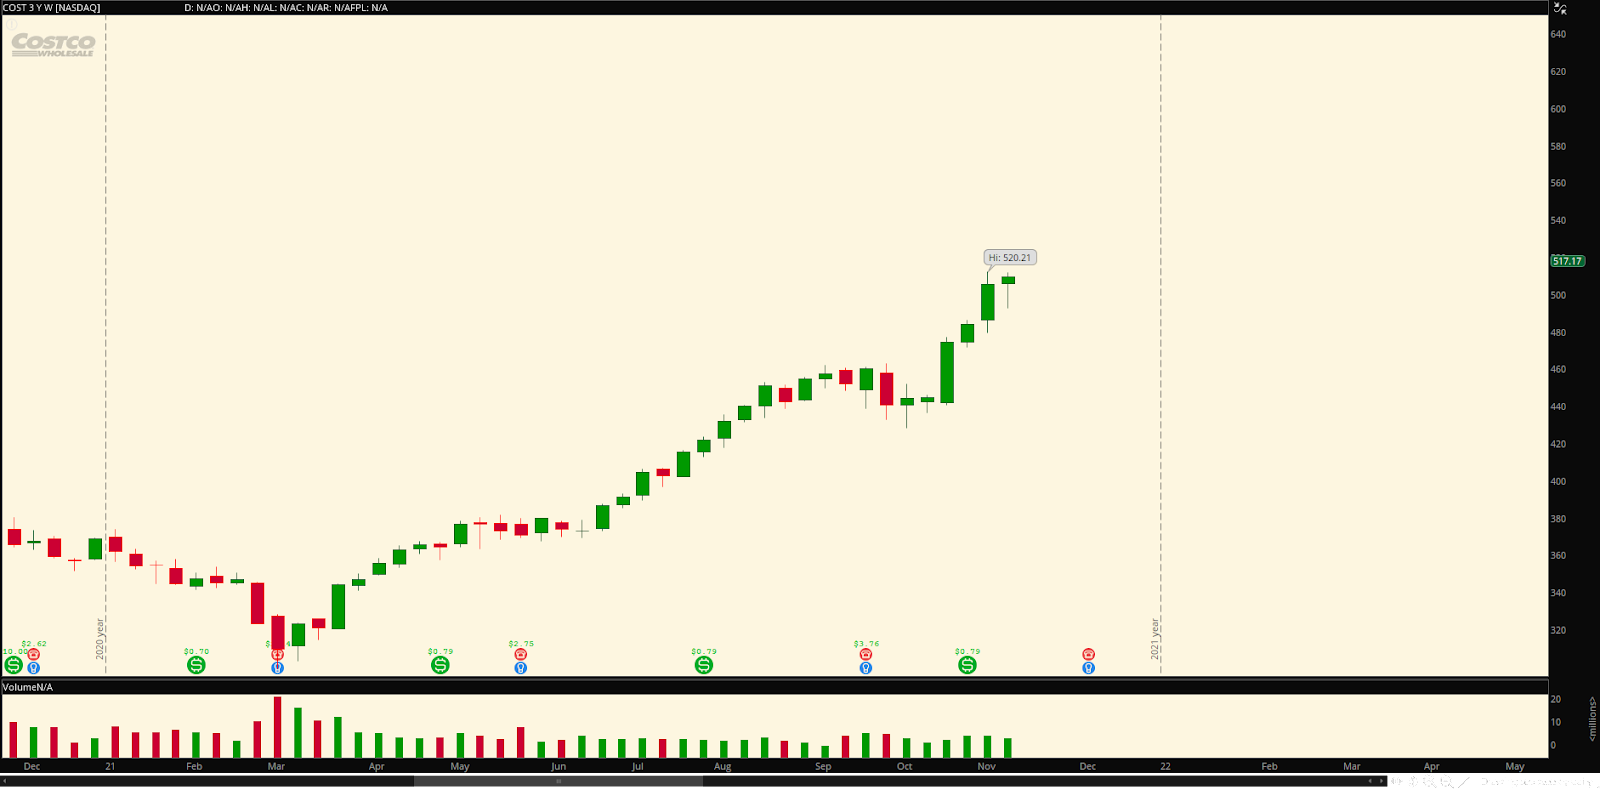
COST Weekly with trend:


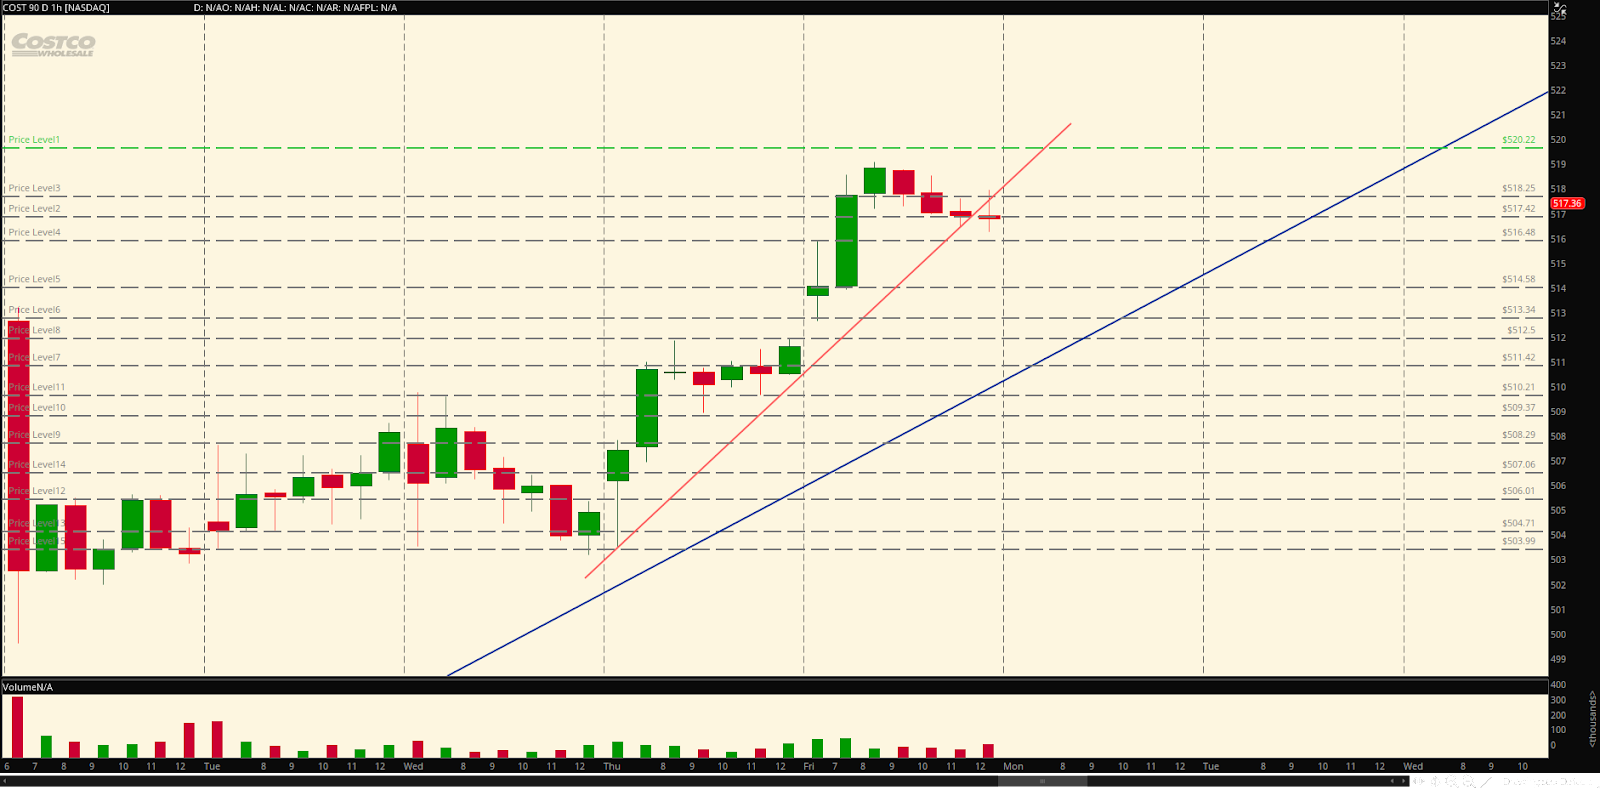
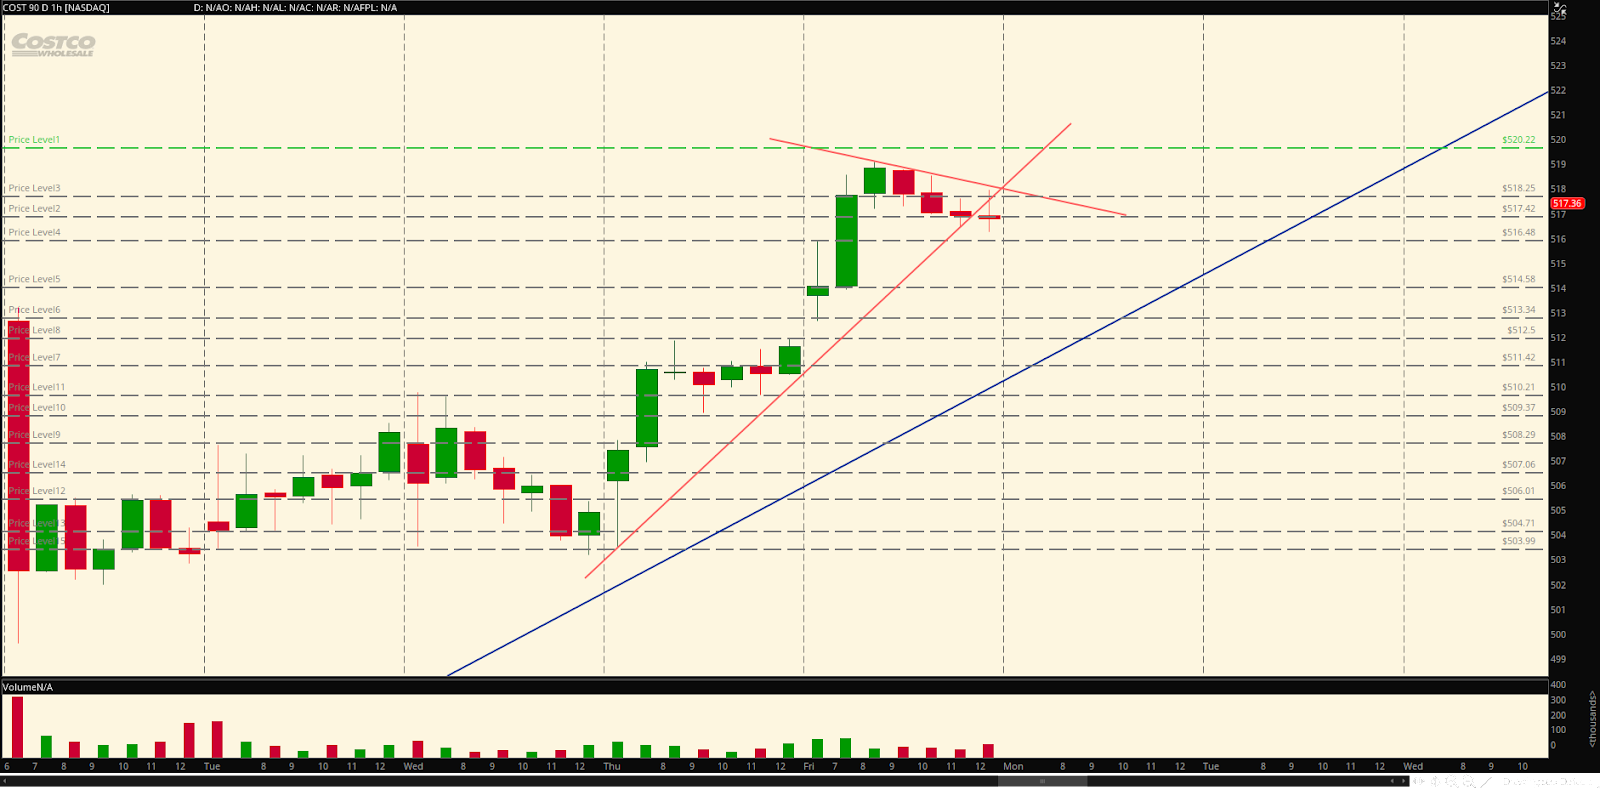
You can see that in the shorter term COST has broken out of its uptrend (above image), but if it reclaims it can easily head over the downtrend and into that green weekly ATH resistance. Next week when you learn about the trigger point, you’ll be able to determine from right in this area where your call or put triggers are.
Further learning: Shorter term trends
For the above weekly and daily trends, these time frames will represent a trigger for swings and longs. Think about it; if something has been stuck in a pattern for weeks, it means it’s more established than one that has been stuck in a pattern for a couple of days, logically. But for day trading rather than going long, you can absolutely find trends on the hourly time frame to trade off of.
❗️NOTE: how trendlines and s/r levels interact to create triggers is for next week. For now you’re just learning how to create each of them, so don’t get too ahead of yourself in thought.
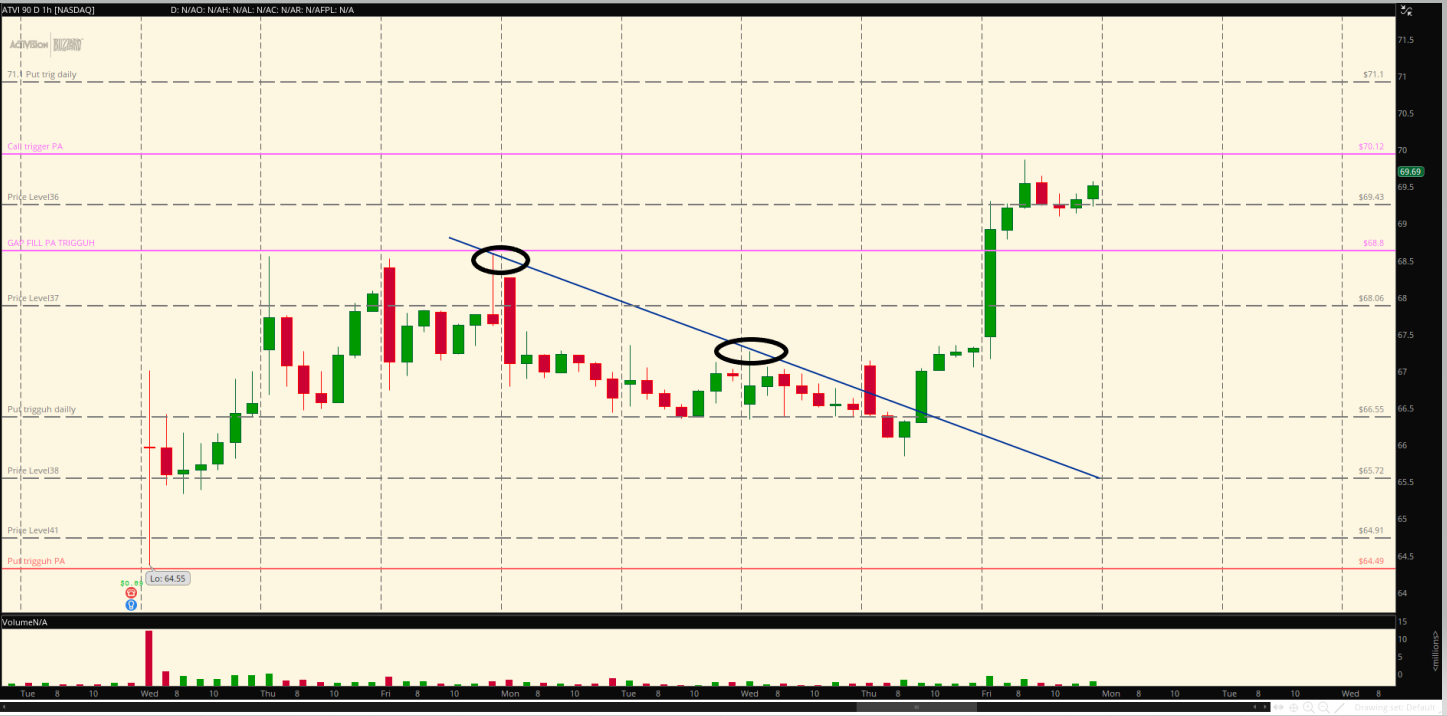
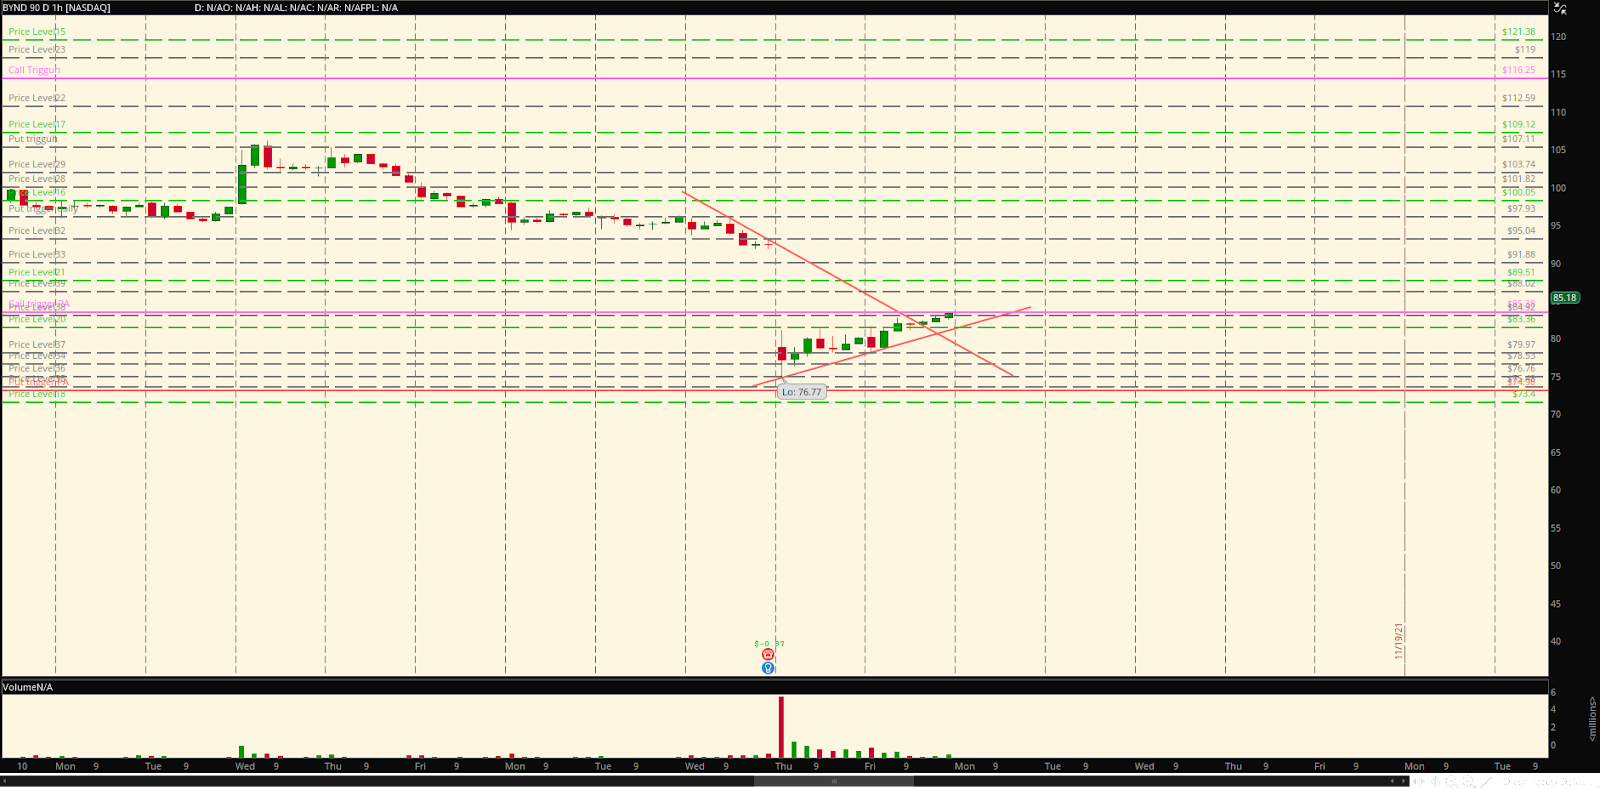
Here are some examples of simple hourly trendlines that recently broke out and are approaching triggers. NOTE: I leave my extended hours trading on when I’m reviewing price action, but you don’t necessarily need to and it’s a bit more advanced. Just know that if you ever see me post or teach a chart that has the grey stripes, it means I have premarket and after hours trading on.
ATVI:
PYPL:

BYND:
BB:
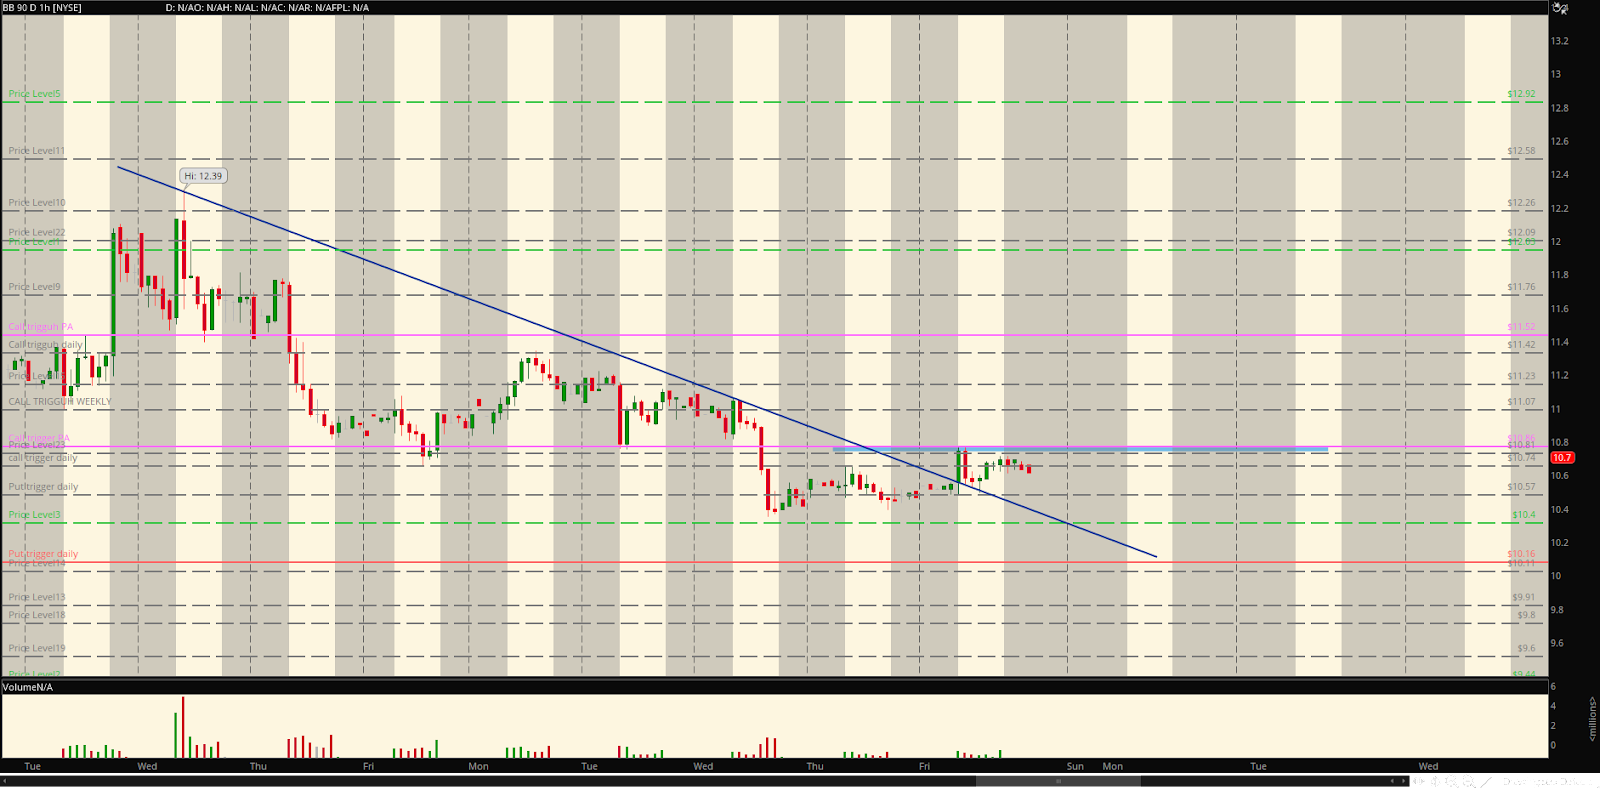
The point here is that you can look for longer term trends (weekly, daily) to support going long or holding swings, and hourly trends to enter shorter term plays like day trades and overnights. You can do hourly time frame trendlines on their own, or you can use them within daily and weekly patterns. When using longer term and shorter term trends together, short term trends on the hourly that are about to head into/break through longer term trends on the daily/weekly end up being an explosive convo.
But, we’ll save that for next week. For now let’s review what you learned, because it was a lot.
Look on the weekly timeframe for trends to see if a play is likely to be a long-term play rather than a day trade. Find trend patterns if you can but don’t force it—just move on down to the daily and look have a look there.
Look on the daily chart to see if you find a trend if you don’t find one on the weekly. This will likely be a mid-term play or a long hold, depending on the length of the trend. It’s much more common to find a strong pattern on the daily than the weekly.
Then look to your hourly time frame for either:
1⃣ Shorter term trends within the longer term trends you’ve found. If the hourly trend is close to a long term trendline, this is a very good thing.
2⃣ Find quicker plays, like day trades, using your hourly trendlines only if weekly/daily trends don’t present themselves, or are far away from the price action.
I hope this wasn’t confusing and you feel well on your way to learning how to create a trigger in our next lesson! Please practice playing around with some charts, and follow mine on twitter—I post my triggers each morning before open. It’s important to me you get a hang of these (debatably) simpler steps, because the next two lessons are going to be a gauntlet. As always feel free to reach out to me on twitter @yourboymilt—I make it a point to try to respond to every message, even though it takes me a bit longer these days than it used to.
Enjoy!
👀 Pt. 4: The Whale Watchlist Picks
🔒 Kalshi Stone Cold Lock of the Week:
NO on MLB Reaching a Collective Bargaining Agreement by January 4th
The MLB Collective Bargaining Agreement has become a mess, and it’s all but a certainty to head deep into the Winter of next year.

Currently contracts to trade against the MLB CBA passing by January 4th on Kalshi are trading at .80—meaning once it it doesn’t pass on January 4th, you’ll receive a cool 20%. Or, you could flip the contract for a profit once it becomes even more certain it’s not passing (if your contracts go from .8 to .9, for example, you can close it for the 10% profit.
If you’re feeling spicy🌶, a YES contract pays out as a 3 bagger.
If none of this makes sense to you, read the article above!
🎯RAMBO to Watch
SpotRambo.com is back, and we’re excited to figure out which catalysts are going to POP. You’re probably wondering if you weren’t around for the first iteration…what the hell is a RAMBO?
RAMBOs are investor Relations And Meeting Buy Opportunities, or in other words stock catalysts outside of earnings (such as Investor Days, Analyst Days, Product Launches, Conferences, and more!). We started Spot RAMBO because it became obvious that with the right combination of factors, many of these events would drive stocks way up—and we were right, we had some INSANE baggers when this was around in 2020.
We tell you what type of event it is
We tell you if there are alerts from Unusual Whales that mean the event could pop, or Unusual Activity and Flow to support strong positive or negative sentiment.
We put a ⭐️ next to events that we think have a good chance of paying off
Here’s a look at the site:

Here’s one we are keeping are eye on this week with a good combination of alerts, flow, and chart.
🎯RAMBO to Watch:
QCOM Investor Day Tuesday at 6am (maybe before the open)

QCOM: Unusual Whales Alerts heading into the event

QCOM: Flow chart headed into the event: 97% Bullish 10k+ Premium
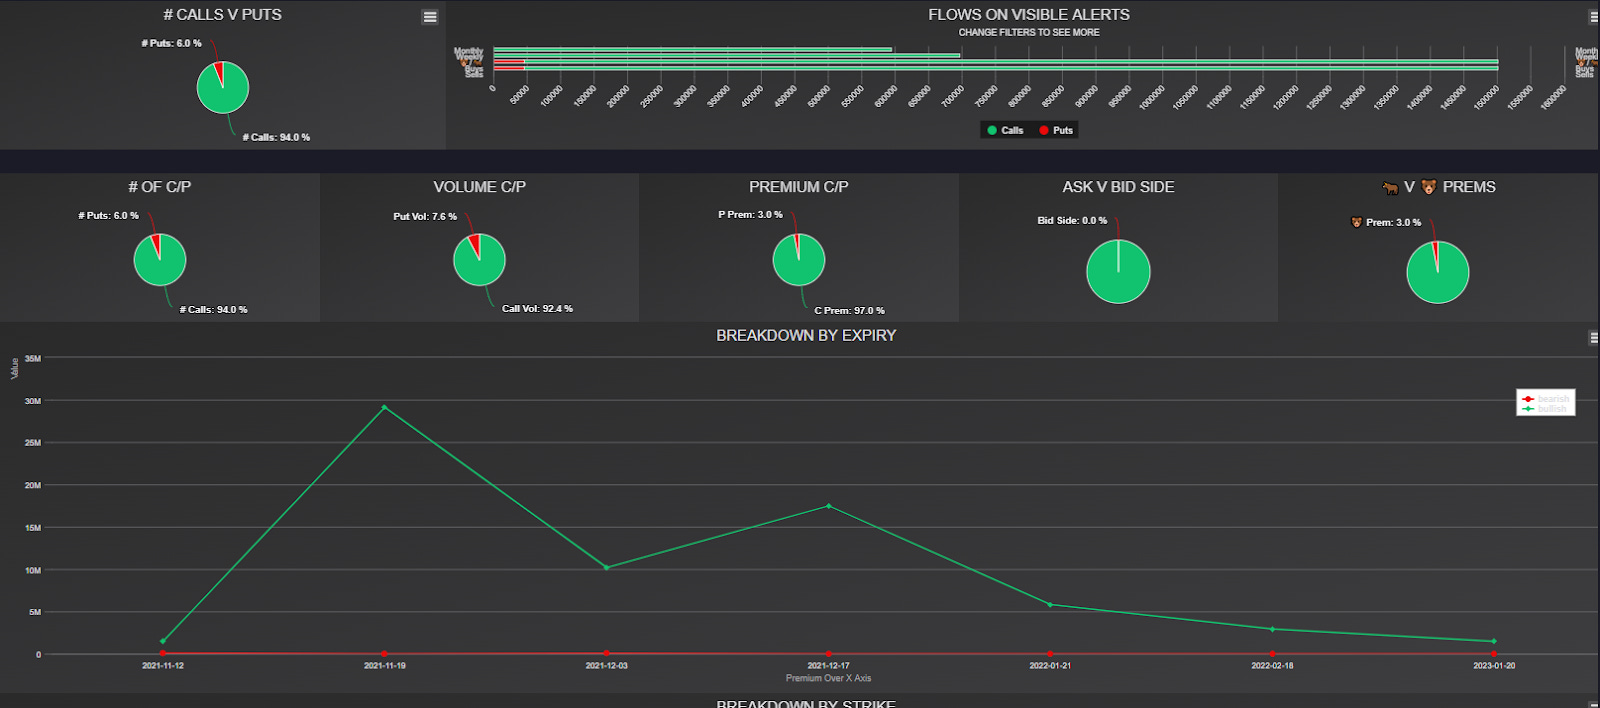
QCOM: Chart
GOOD LUCK!
👀 The Watchlist: AMD, TLRY, ⭐️PLTR, AFRM, CHWY, ATVI
Please note—don’t just dive into a play, wait for a trigger...and then a retest. By retest we mean a candle on the 5, 10, or 15 minute interval retouching the trigger and closing above, showing strength. You may miss a few rockets, but you’ll save yourself a lot of pain!
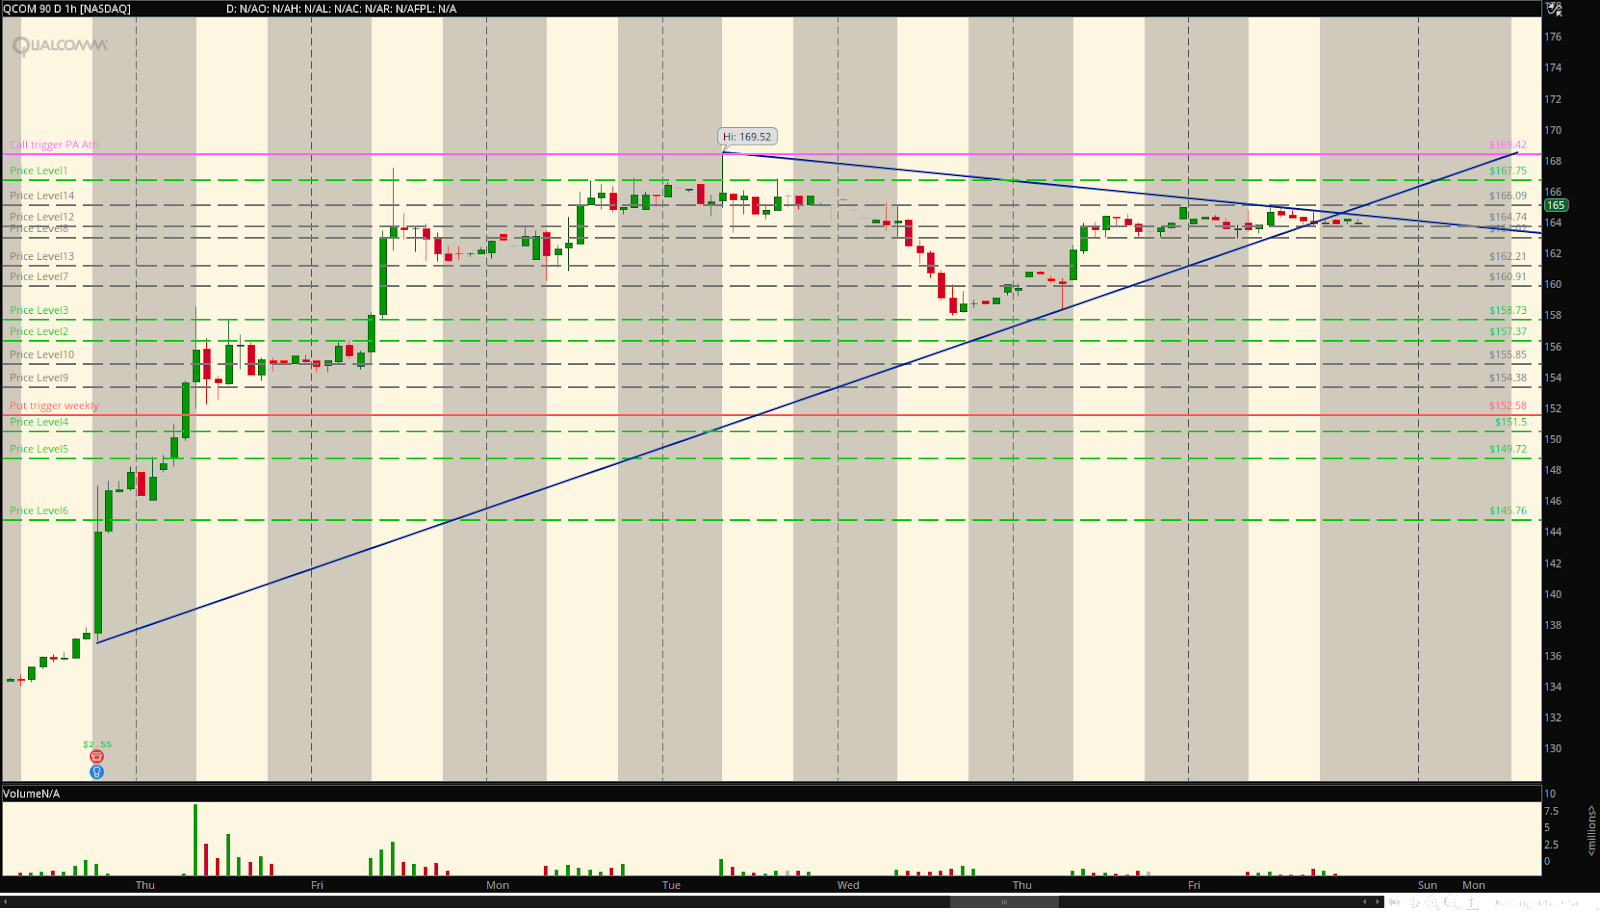
1. AMD Calls > 149.88
📈 AMD: Flow Chart: 25k+ Premium: 88%🐂
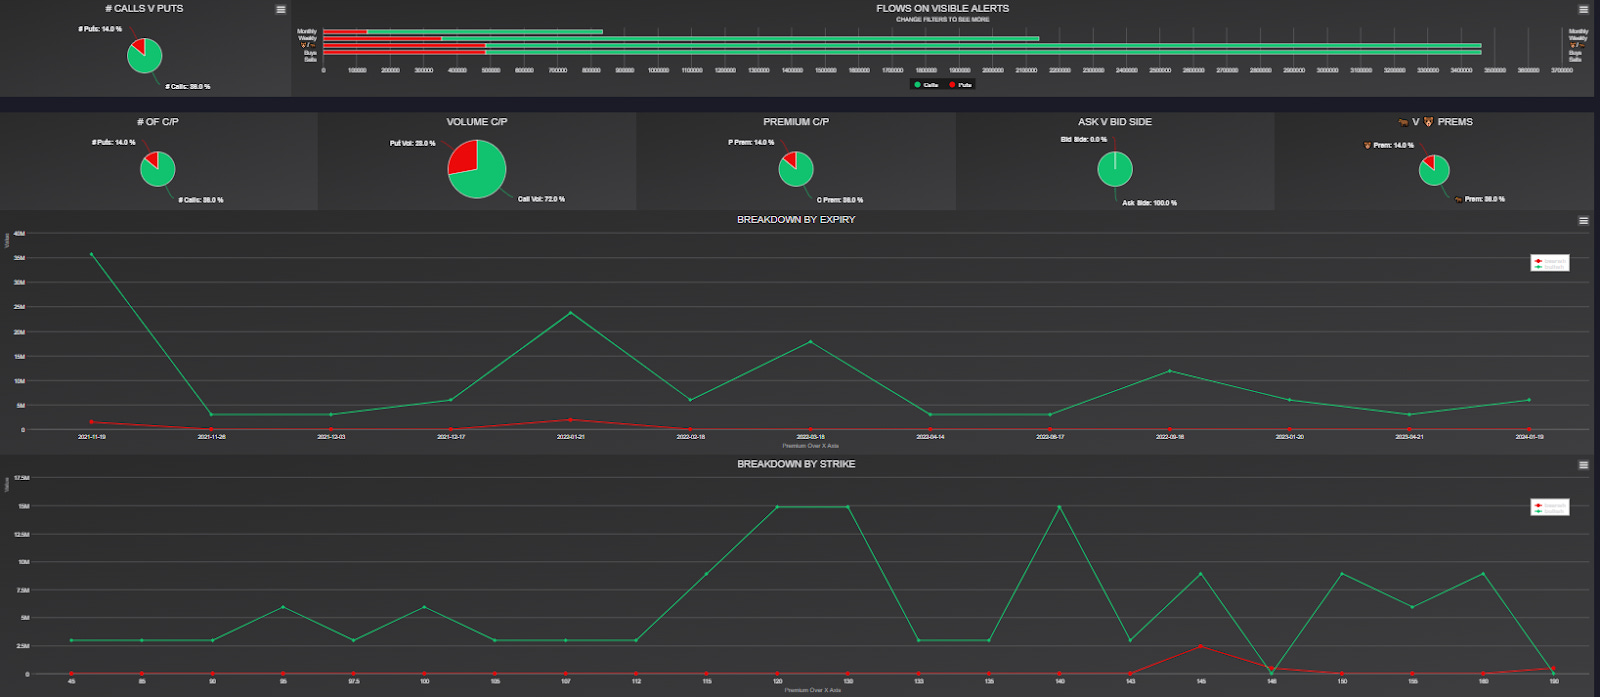
⌚️AMD: Expirations and Strike
⌚️Exp: 11/19, 1/21, 2/18🐂
🔨Strikes: 120, 130, 140🐂
📊 AMD: Chart
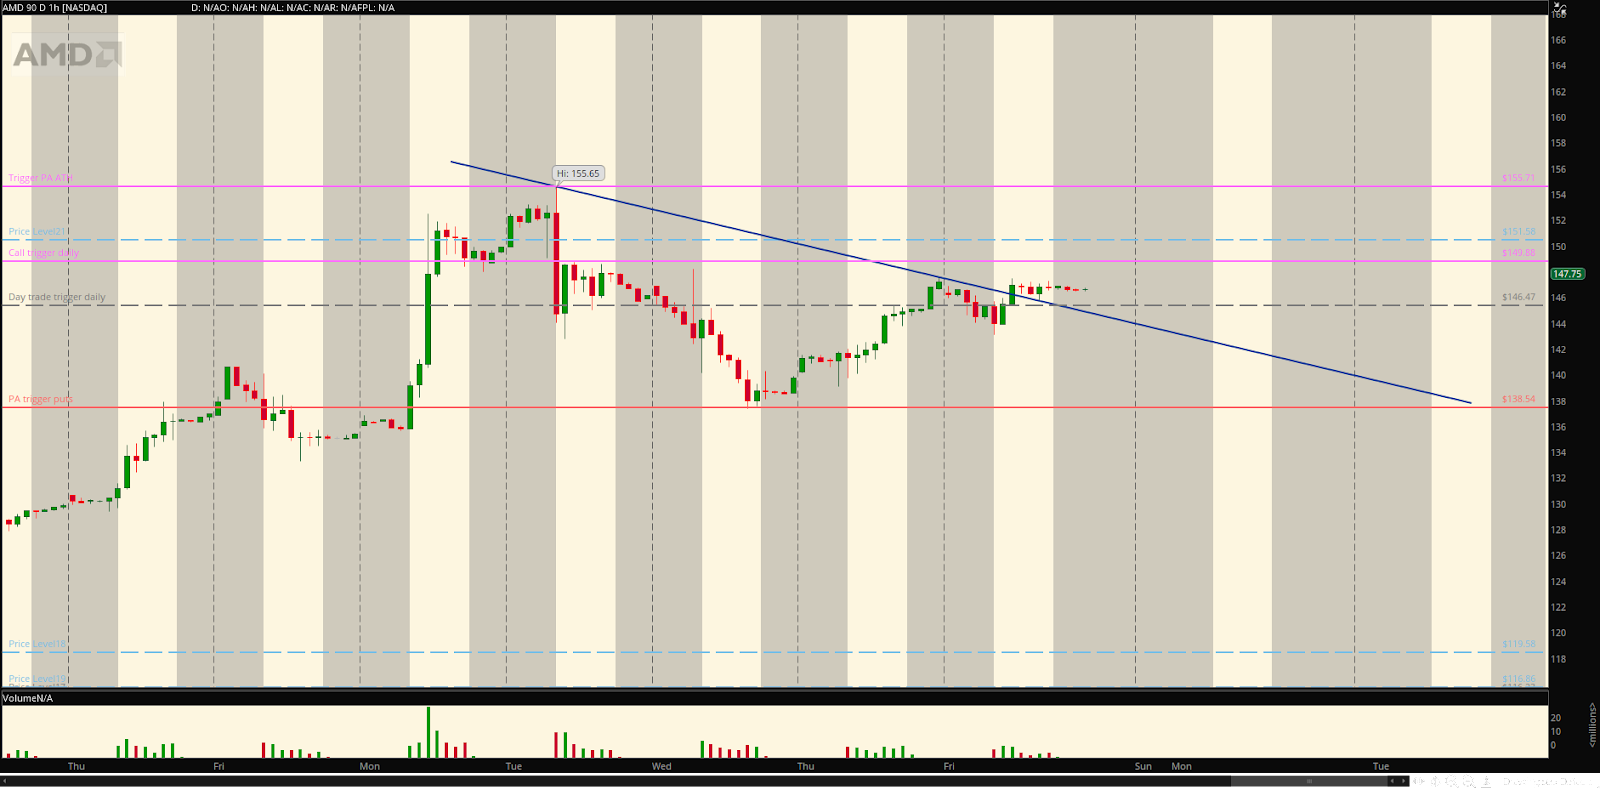
🔫 The AMD Trigger: 149.88
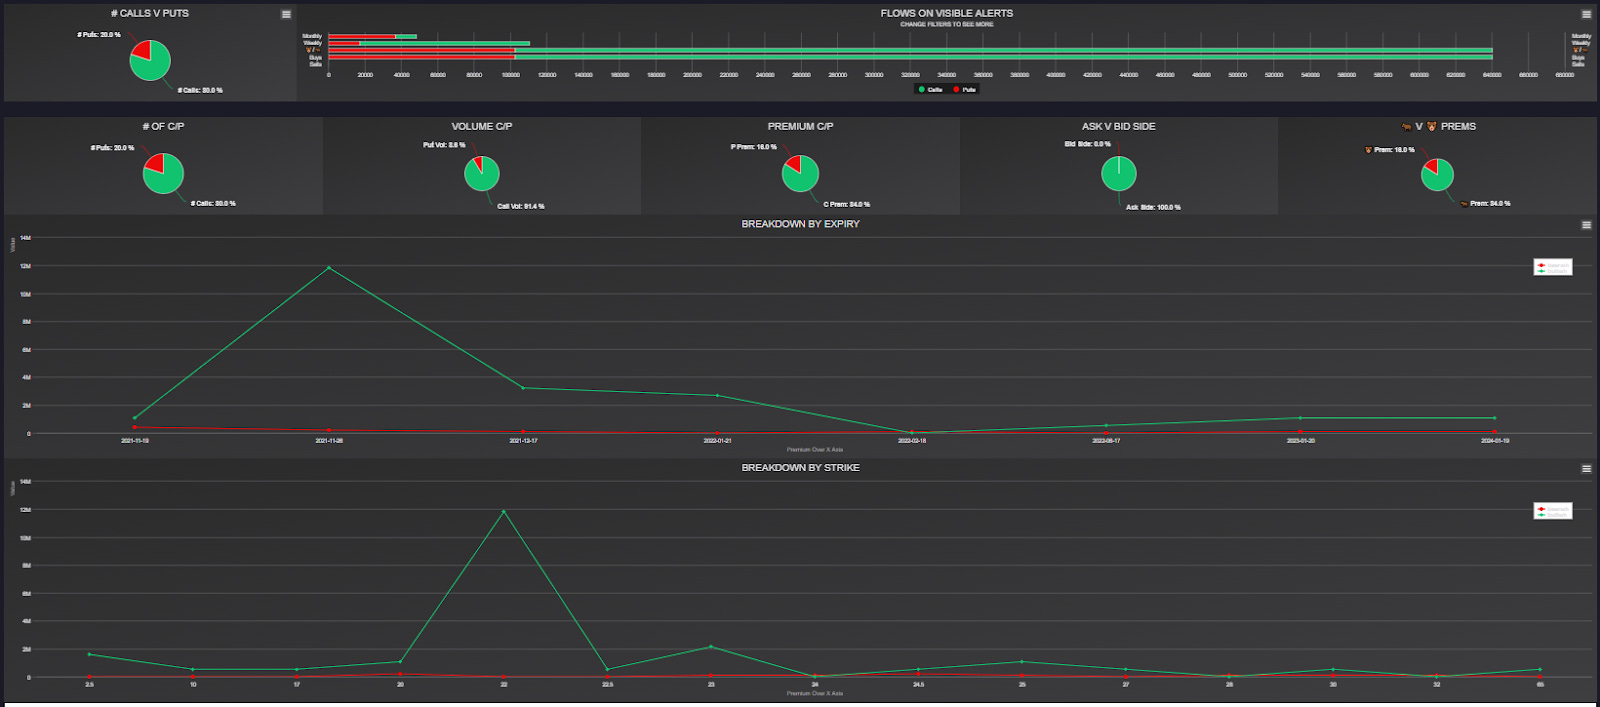
2. TLRY Calls >13.25
📈 TLRY: Flow Chart 5k+ Premium: 78%🐂

⌚️TLRY: Expirations and Strike
⌚️Exp: 11/19, 12/17, 1/21🐂
🔨Strikes: 13 🐂
📊 TLRY: Chart
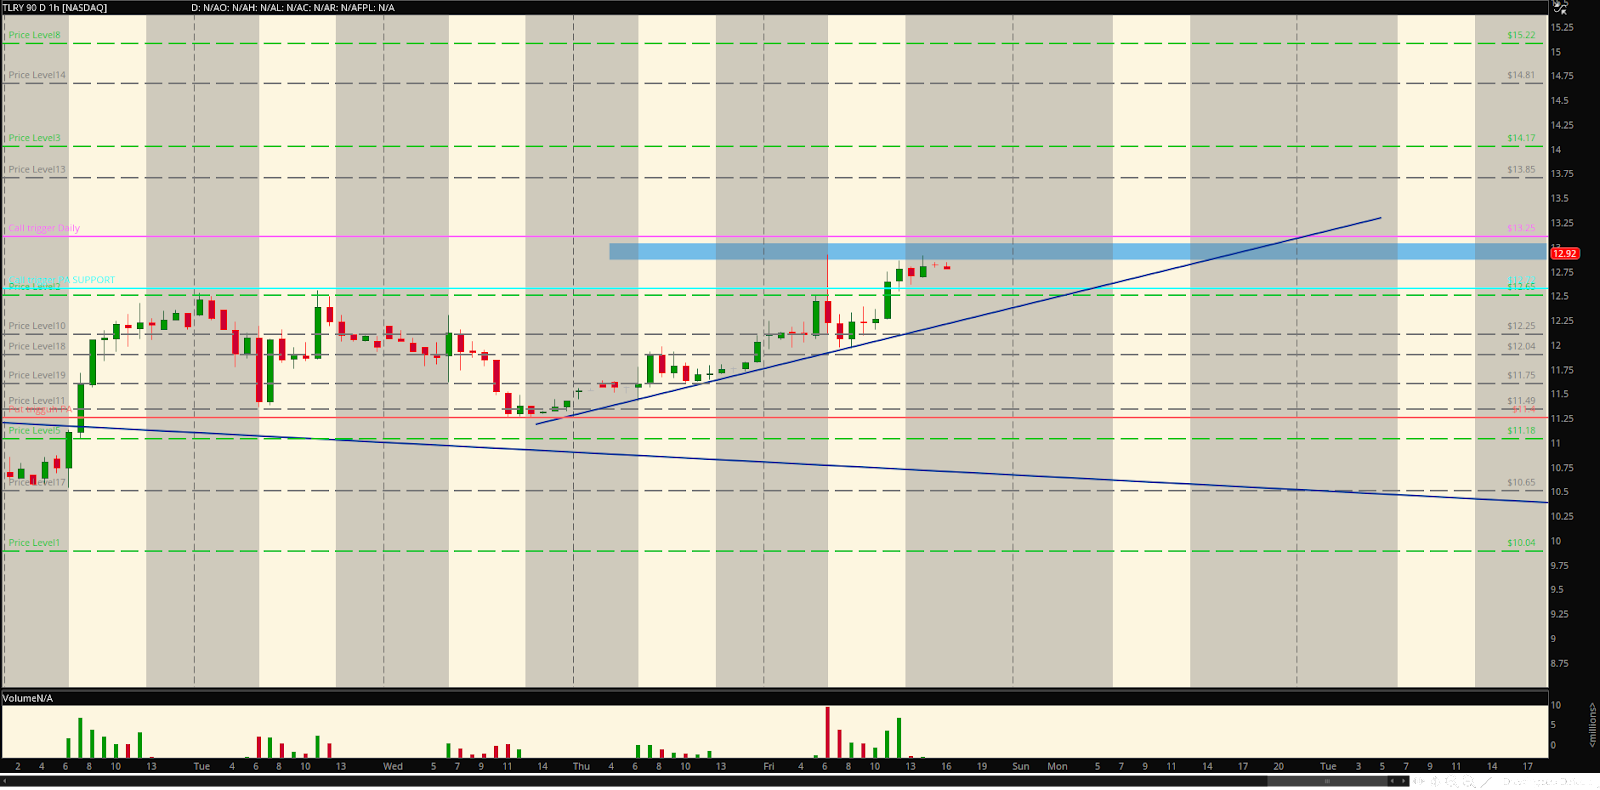
🔫 The TLRY Trigger: 13.25
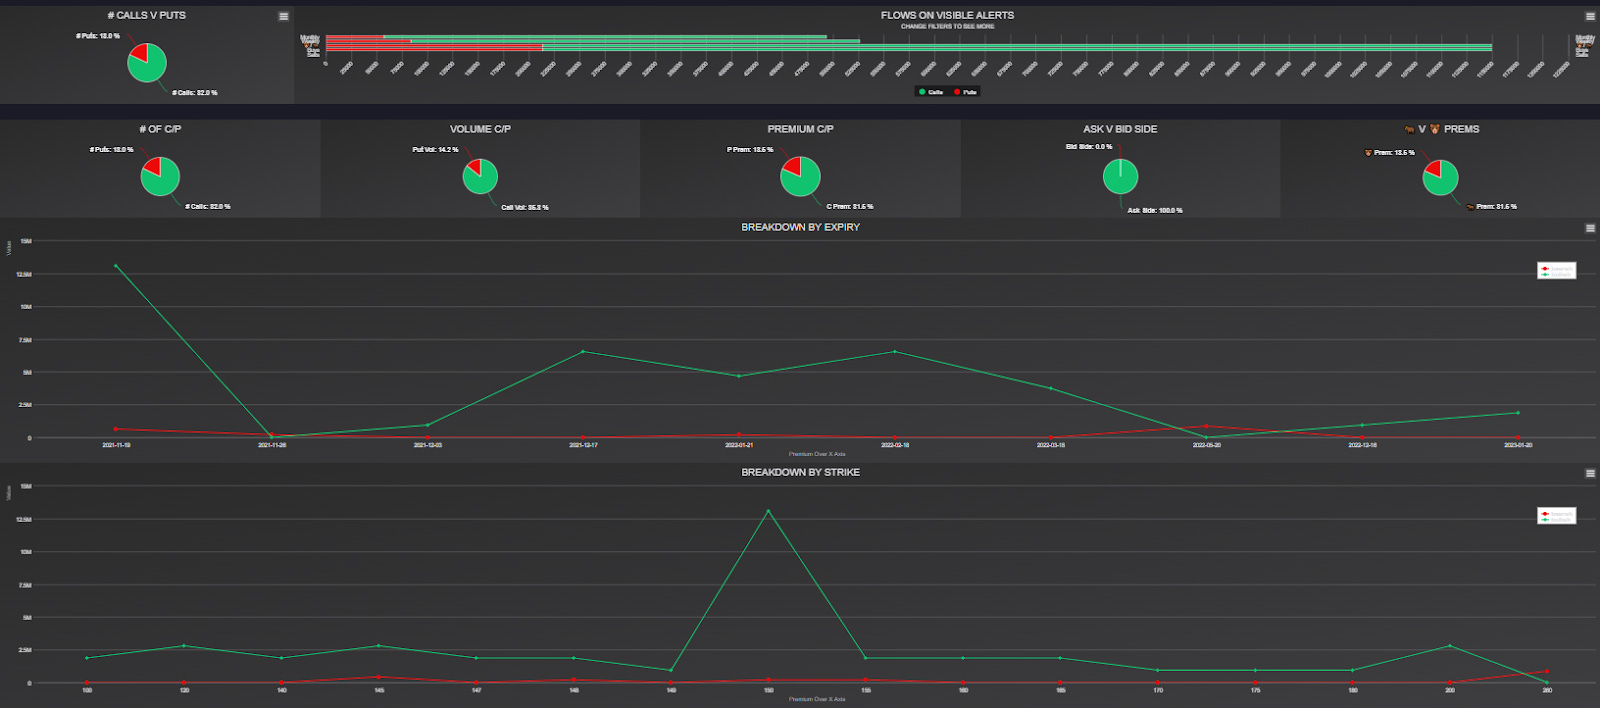
⭐️ 3. PLTR > 23.22
📈 PLTR: Flow Chart 5K+ Premium: 84% 🐂
⌚️PLTR: Expirations and Strike
⌚️Exp: 12/18🐂
🔨Strikes: 22🐂
📊 PLTR: Chart
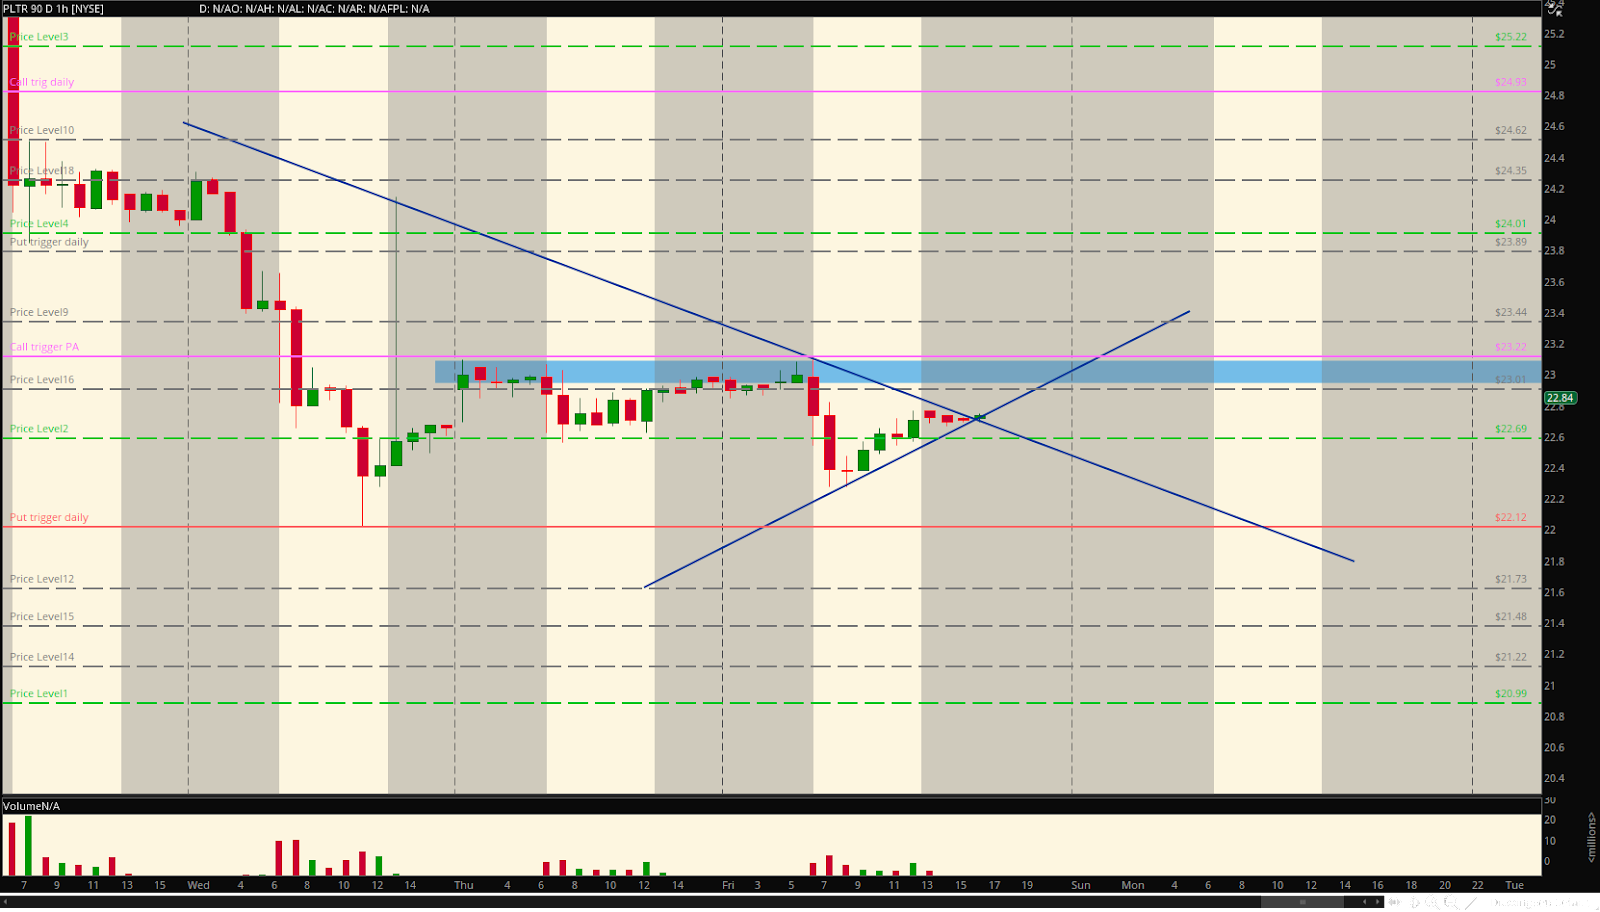
🔫 The PLTR Trigger: 23.22
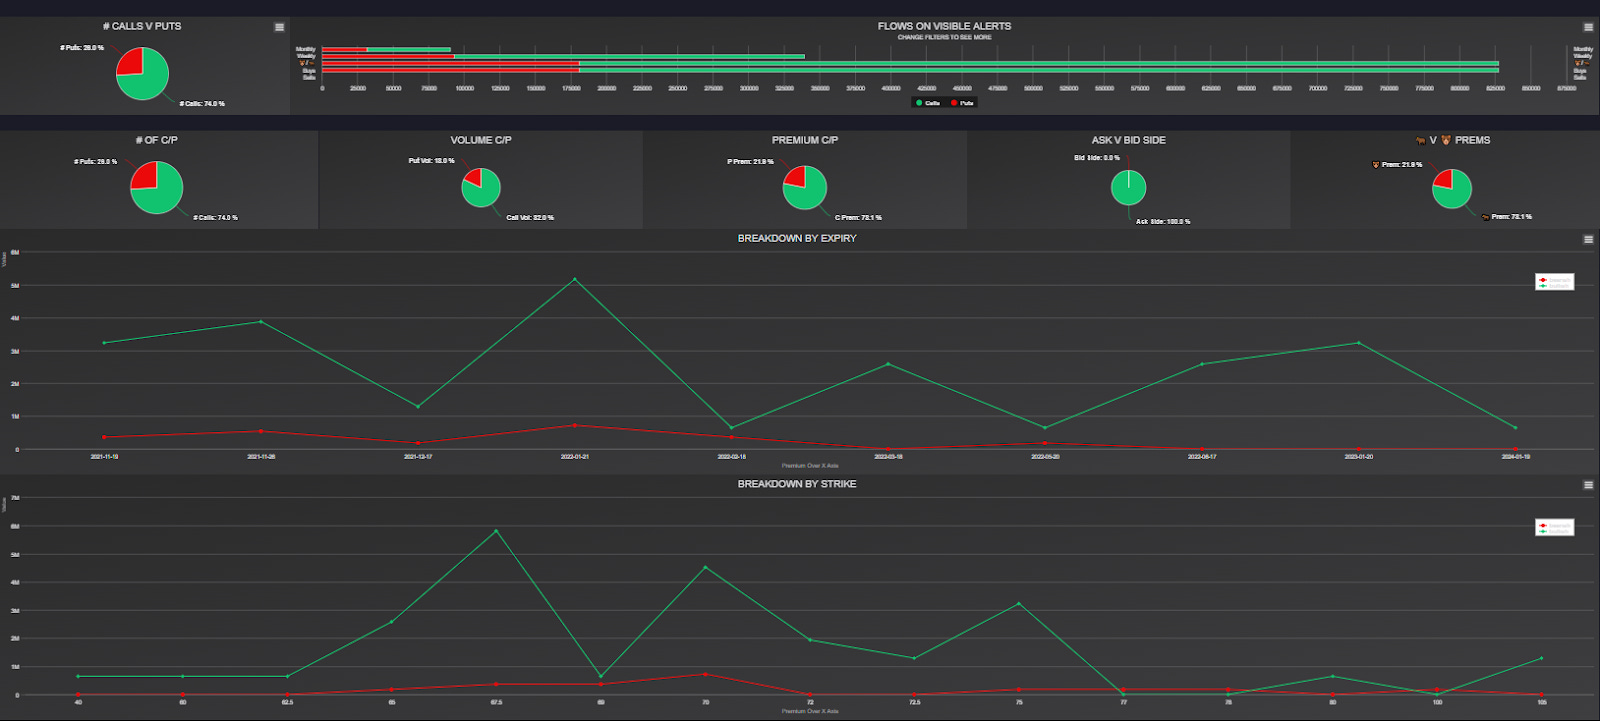
4. AFRM > 150.2 An UNCLE ABU (@abuomegatrigga) Pick of the Week!
📈 AFRM: Flow Chart 10k+Premium 82%🐂
⌚️AFRM: Expirations and Strike
⌚️Exp: 11/19, 12/17, 1/21, 2/18🐂
🔨Strikes: 150🐂
📊 AFRM: Chart
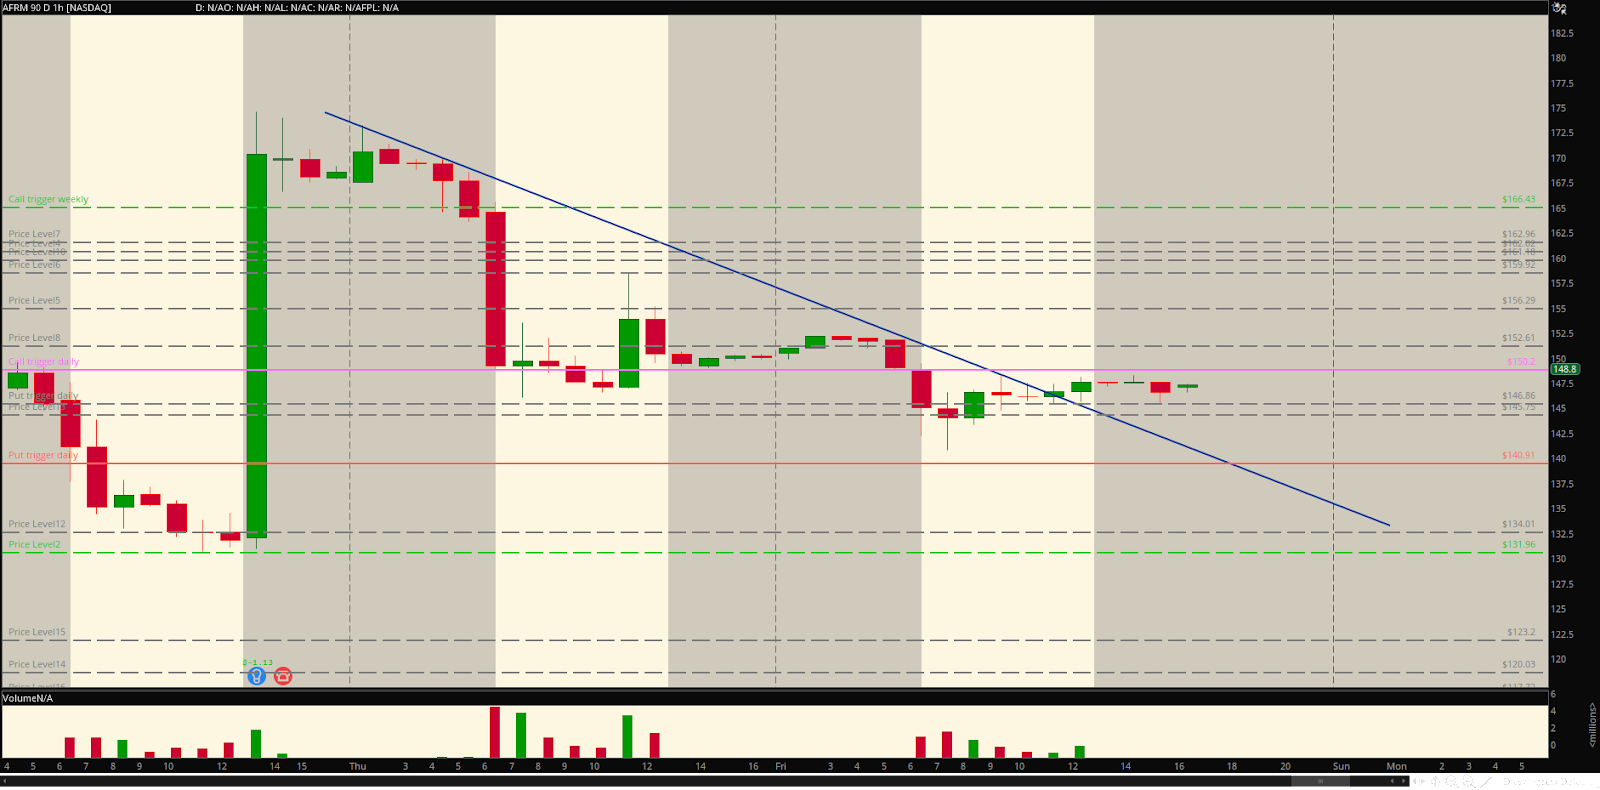
🔫 The AFRM Trigger: 150.2
5. CHWY > 77.54
📈 CHWY: Flow Chart 10k+ Premium: 87%🐂

⌚️ CHWY: Expirations and Strike
⌚️Exp: 11/19, 12/17, 1/21🐂
🔨Strikes: 73, 74, 75, 80🐂
📊 CHWY: Chart

🔫 The CHWY Trigger: 77.54
6. ATVI Calls > 70.2
📈 ATVI: Flow Chart 5k+ Premium: 78%🐂
⌚️ATVI: Expirations and Strike
⌚️Exp: 11/26, 1/21, LEAPs🐂
🔨Strikes: 67.5, 70, 75🐂
📊 ATVI: Chart
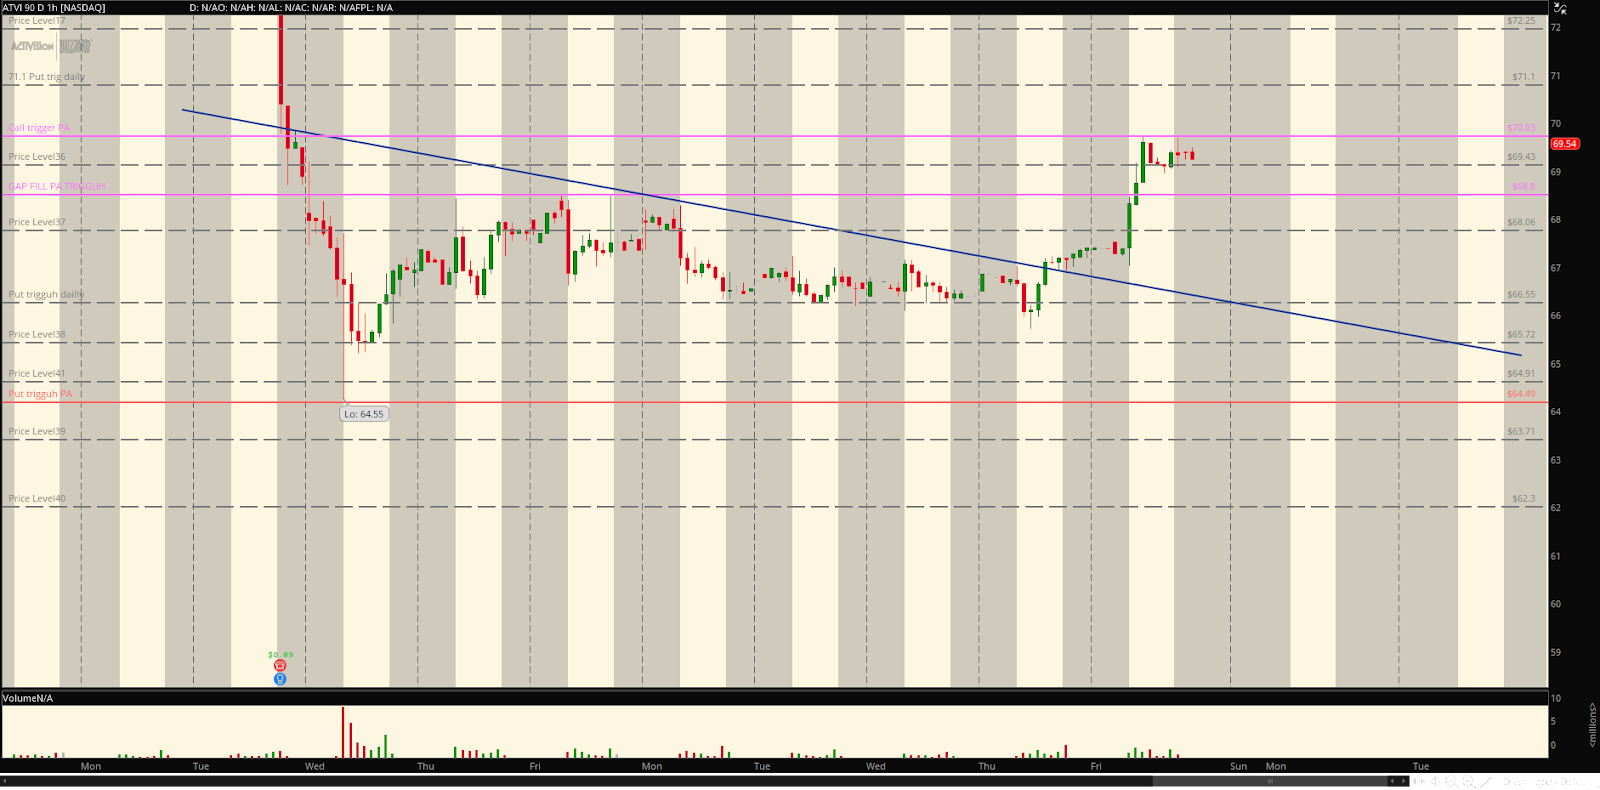
🔫 The ATVI Trigger: 70.2
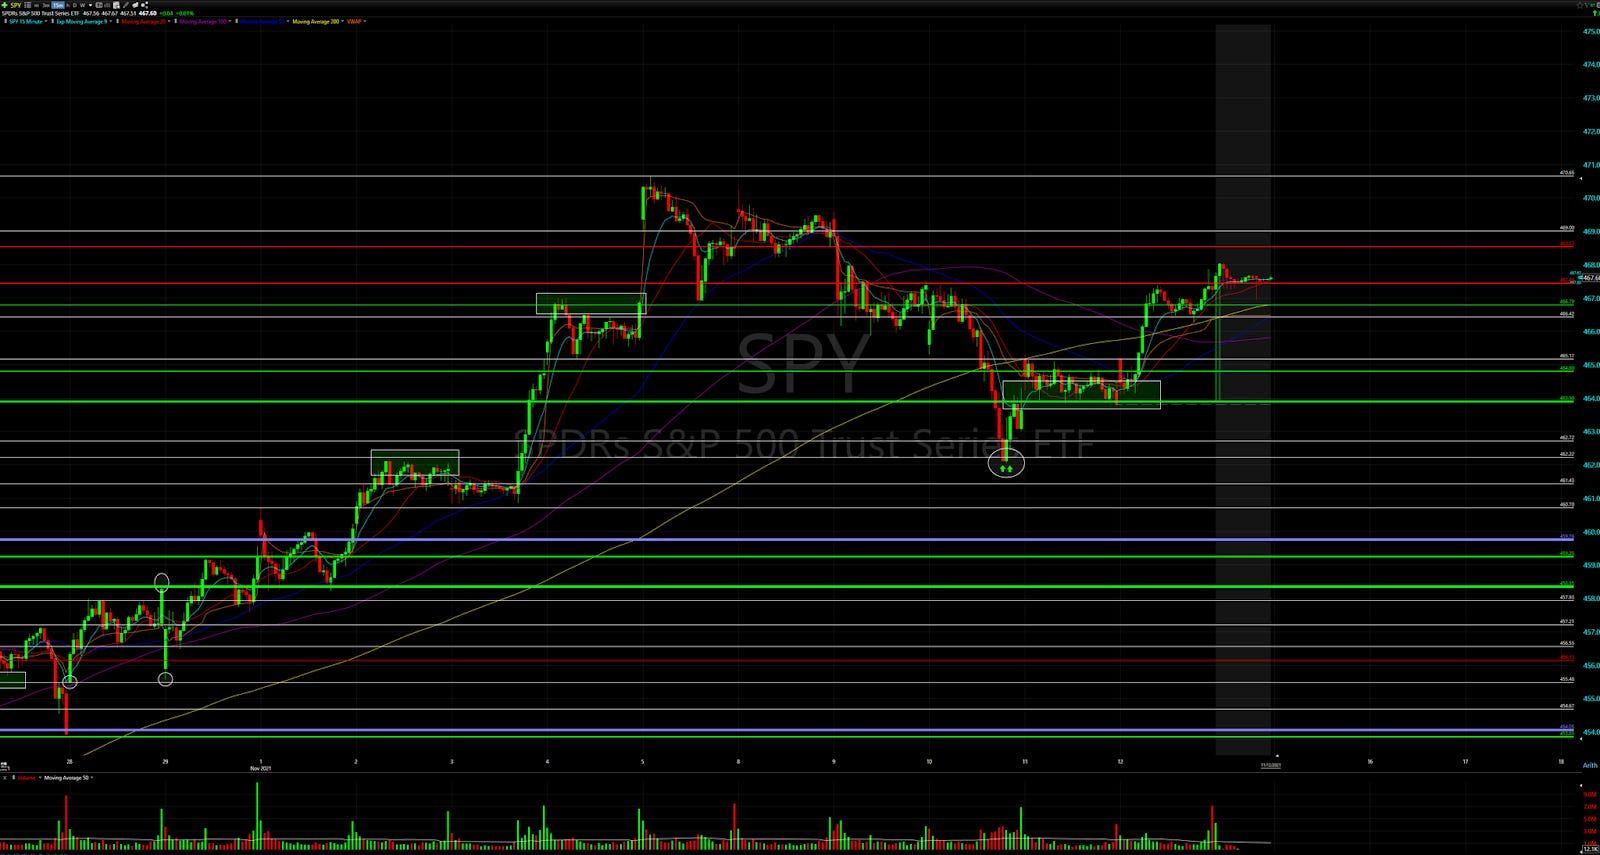
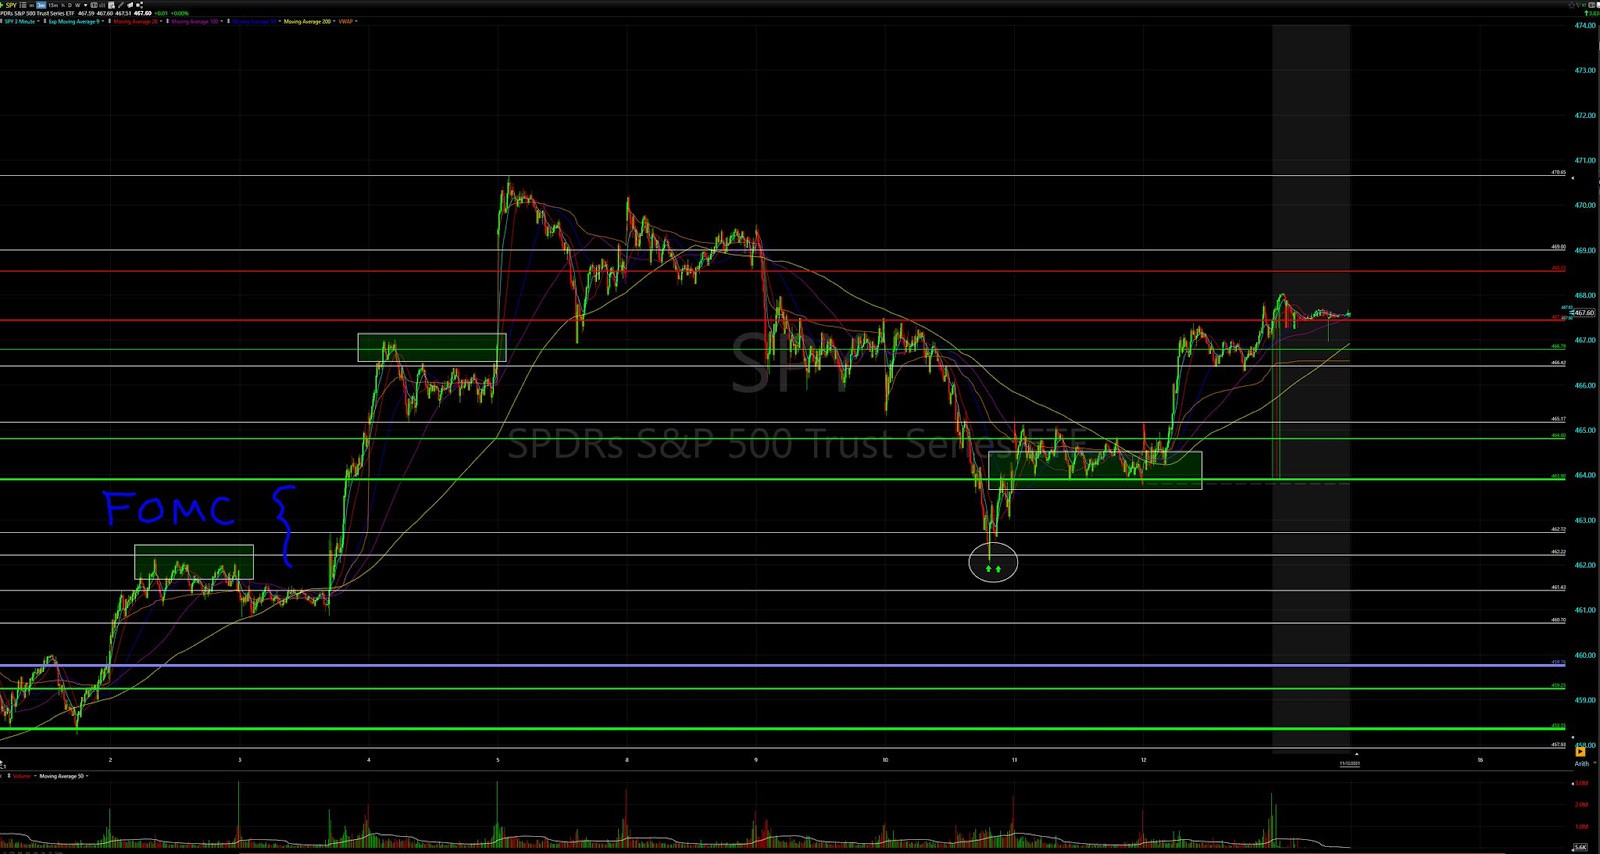
Pt. 5: Weather: SPY, SPX & QQQ Forecast by @daarkmaagician 🌦
Below is the chart & info for a SPY, SPX & QQQ forecast from @daarkmaagician, his DISCORD is the place to be (YEETers get two weeks free!).
SPY/QQQ Charts Legend:
Solid Blue= ATH, Green= Dark Pool Buys, Red= Dark Pool Sells, Purple= Dark Pools, Orange= Supports/Resistances, Teal= 9ema
SPY Forecast:

SPY Charts:

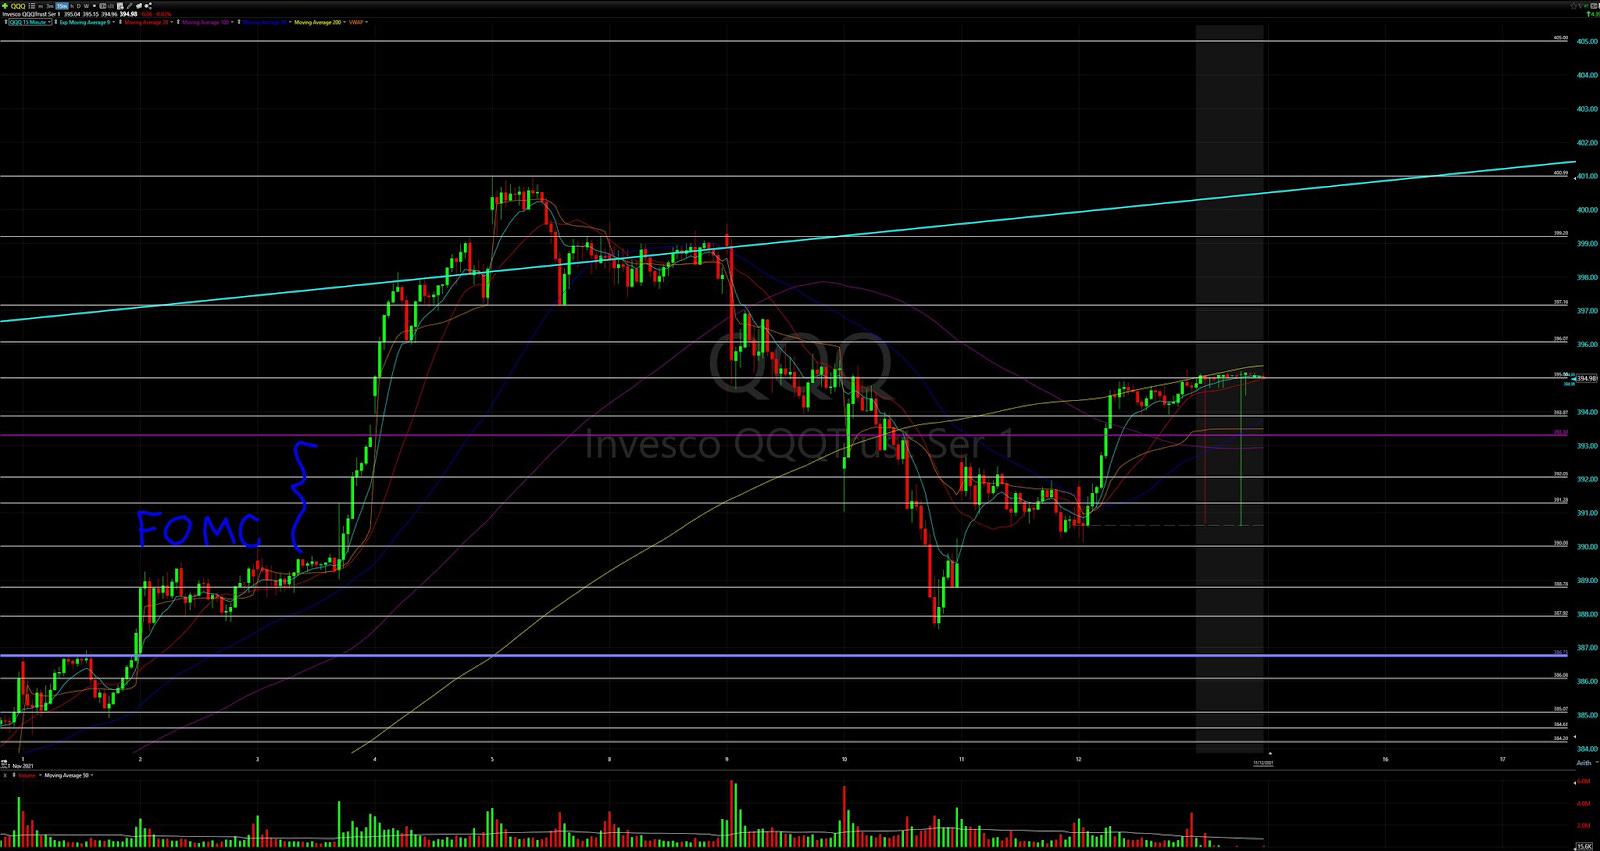
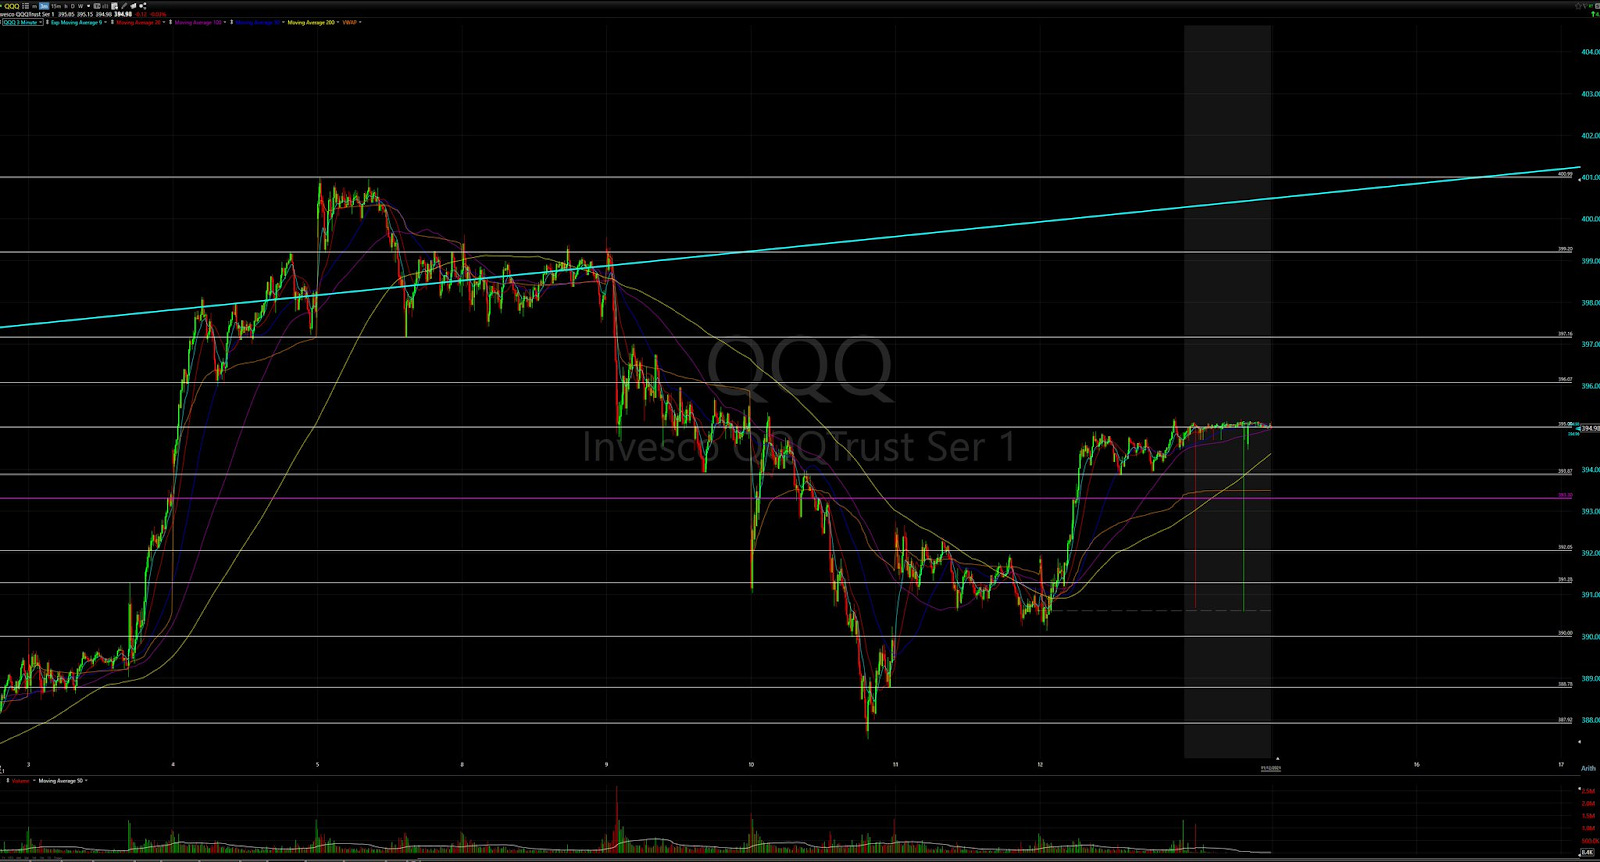
QQQ Forecast:

QQQ Charts:
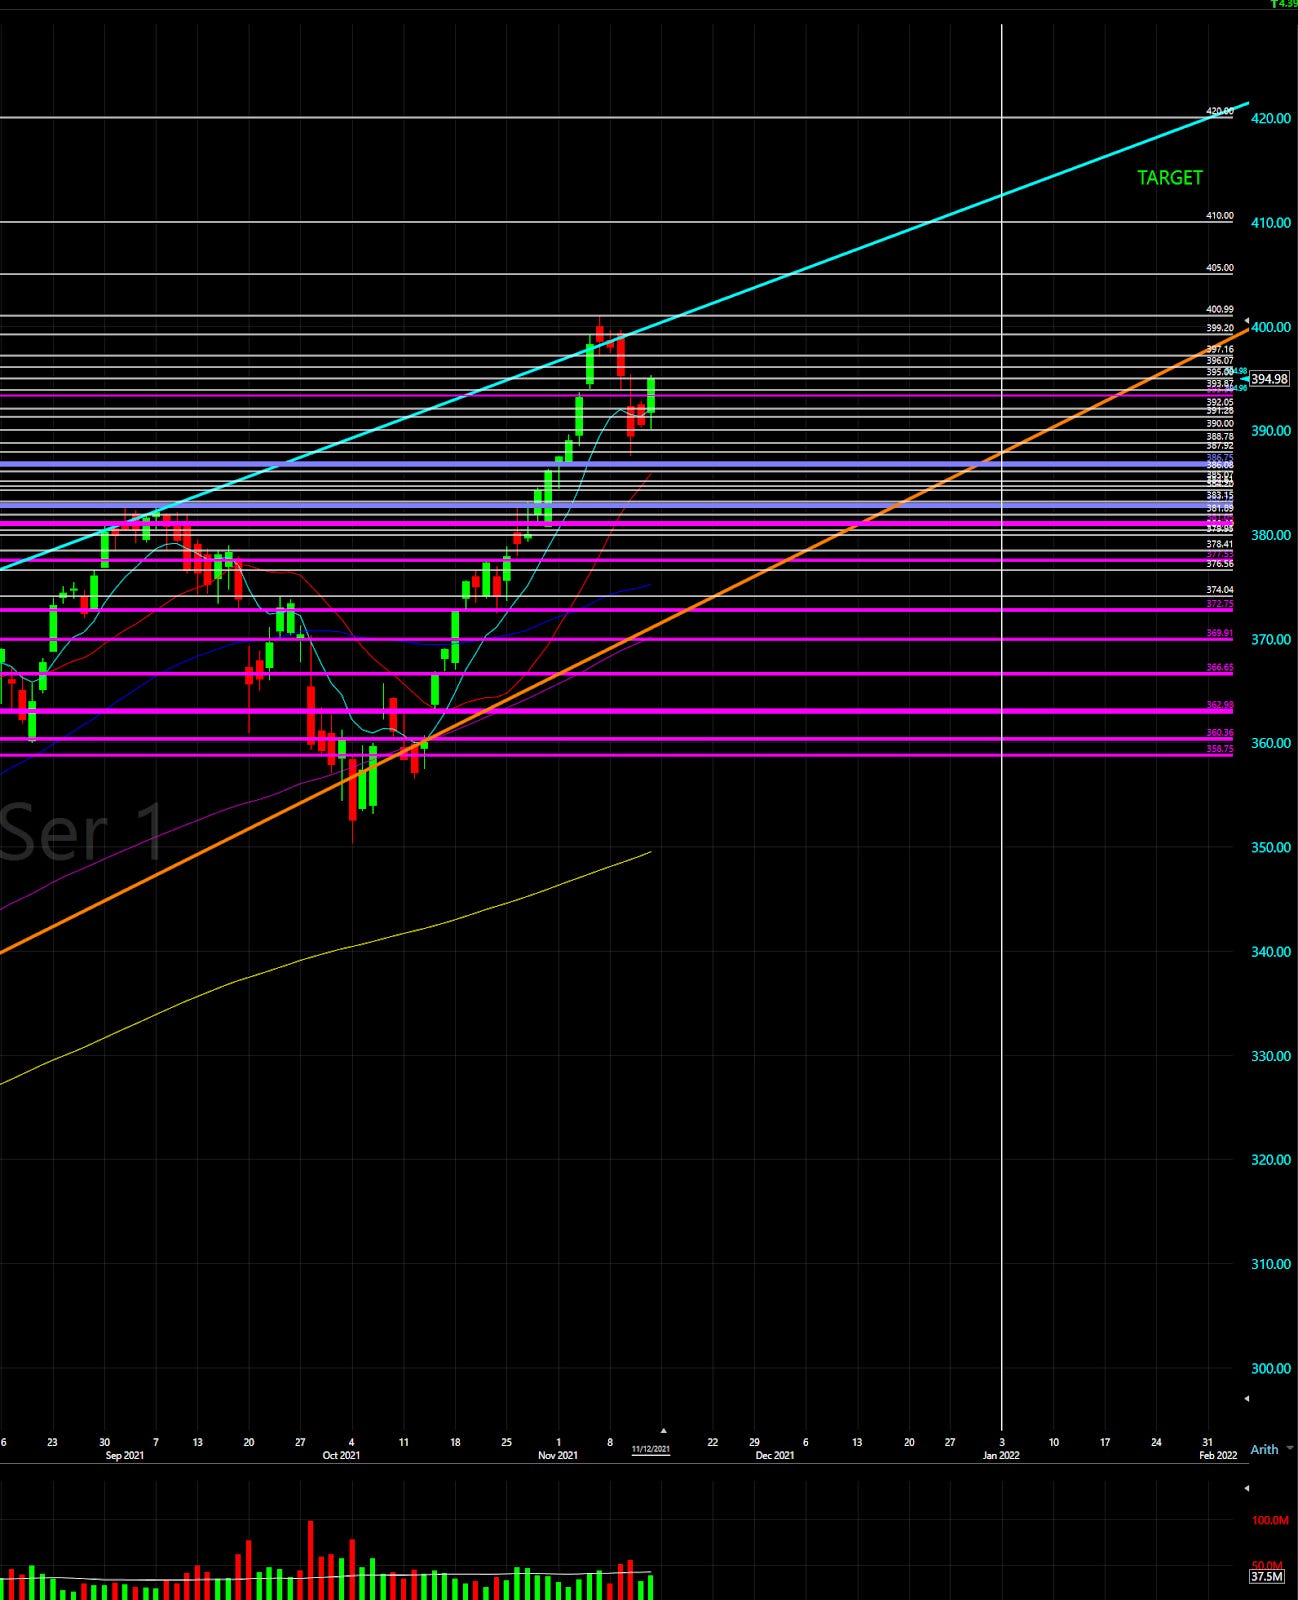
Make sure you follow @daarkmaagician to get updates on the indexes daily!
Pt. 6: TLDR & GOODBYE ✌️
TLDR:
Pt. 2: Using Kalshi to Trade Jerome’s Reappointment - With explanations of how the site works.
Pt. 3: Build-A-Trader (B-A-T) 10: Triggers 102 -Trendlines. Building on last week’s tutorial on how to find triggers the YEET way.
Pt. 4: YEET PICKS ⬇️
🎯RAMBO to Watch: QCOM Investor Day Tuesday at 6am
🔒 Kalshi Stone Cold Lock of the Week: NO on MLB Reaching a Collective Bargaining Agreement by January 4th
👀 The Watchlist: AMD, TLRY, ⭐️PLTR, AFRM, CHWY, ATVI
Pt. 5: SPY & QQQ Forecast by @daarkmaagician
Goodbye and thanks for reading! Questions, scoops, comments @yourboymilt or /u/alldatdalton. See you next week! ✌